Acclarix LX9 Series Diagnostic Ultrasound System User Manual
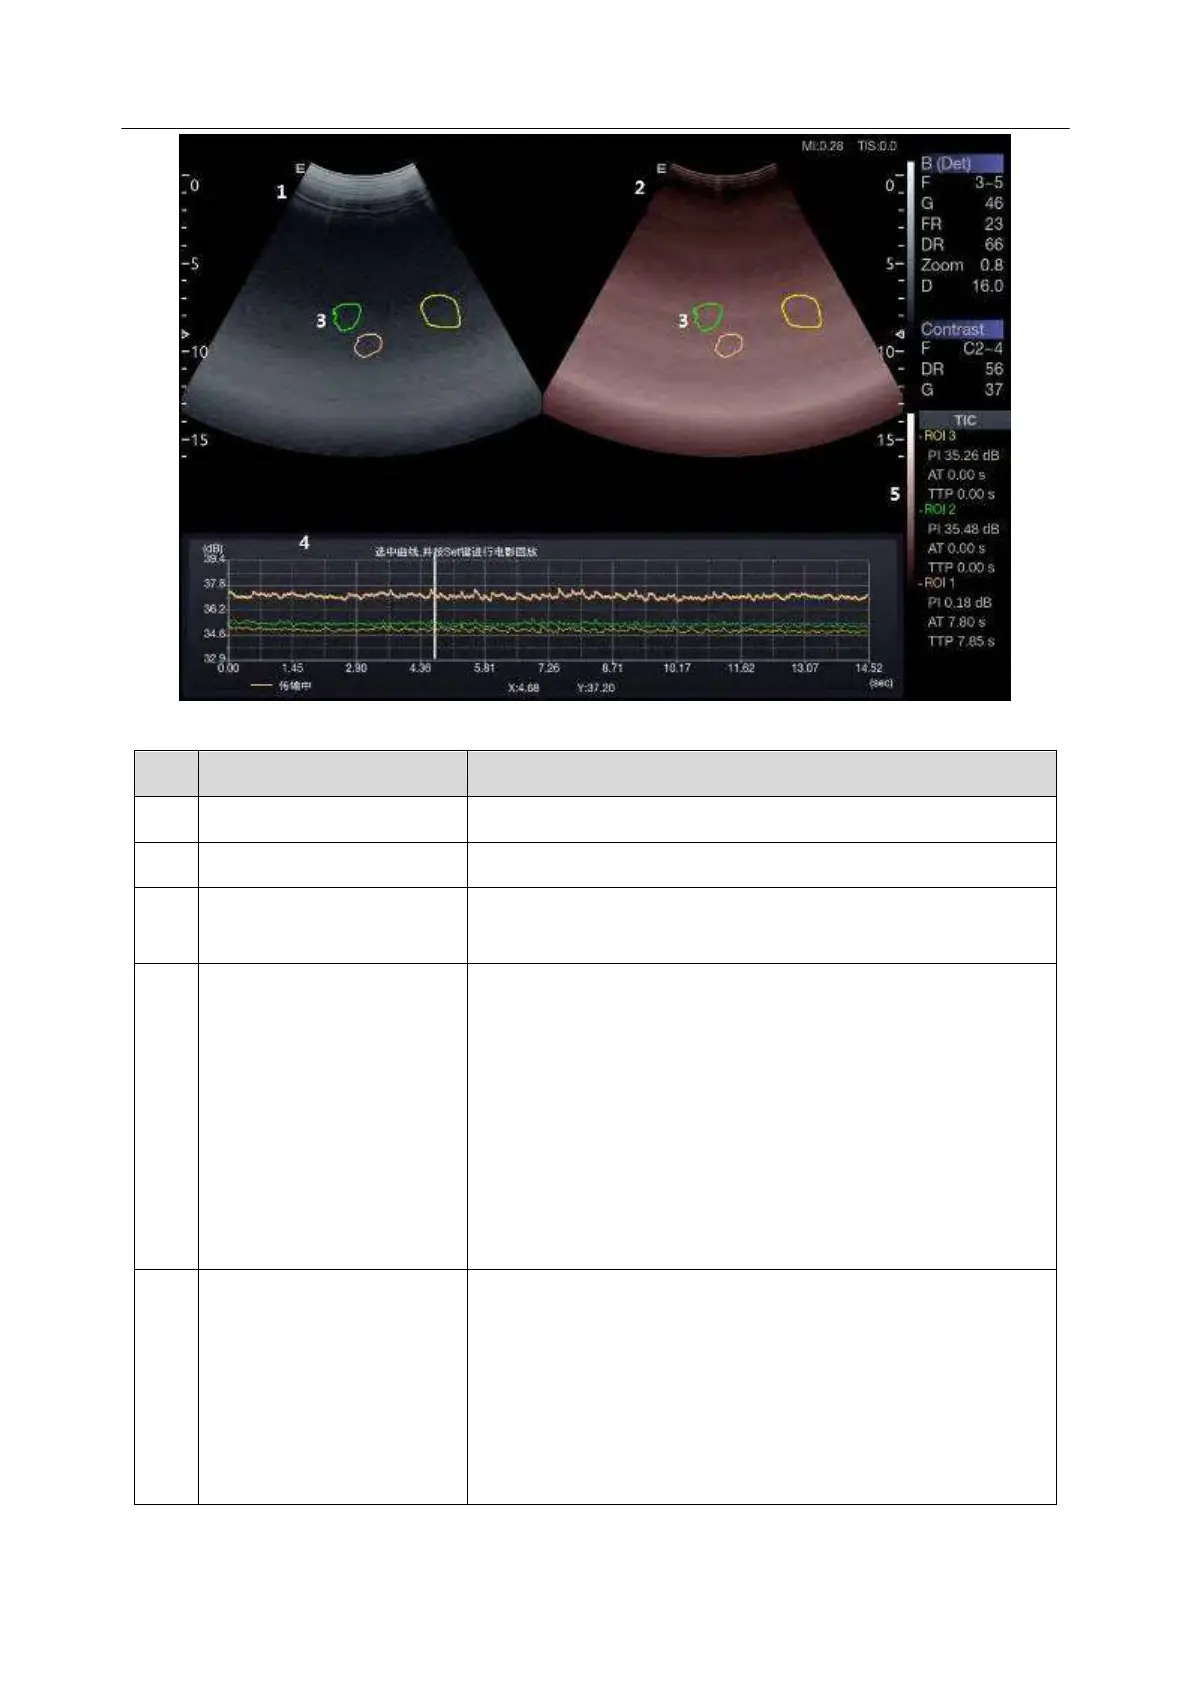
Figure 5-11 Example of TIC Analysis Display
Displays contrast cineloop and ROIs.
Displays tissue cineloop and ROIs.
The ROI indicates sampling position of the TIC. ROIs are
color-coded, and up to 7 ROIs can be displayed.
The TIC Analysis window displays:
Y axis represents intensity scale (dB).
X axis represents time (sec).
Time intensity curves, coded with the same color of its
sample area.
Frame marker, a white vertical line.
Time at the frame marker position.
Intensity at the frame marker position.
The active curve.
Displays TIC parameters of each sample area (ROI). These
parameters include:
PI (Peak Intensity): contrast peak intensity.
AT (Arrival Time): time point where contrast intensity
appears.
TTP (Time to Peak): time point where the contrast
intensity reaches peak value.
 Loading...