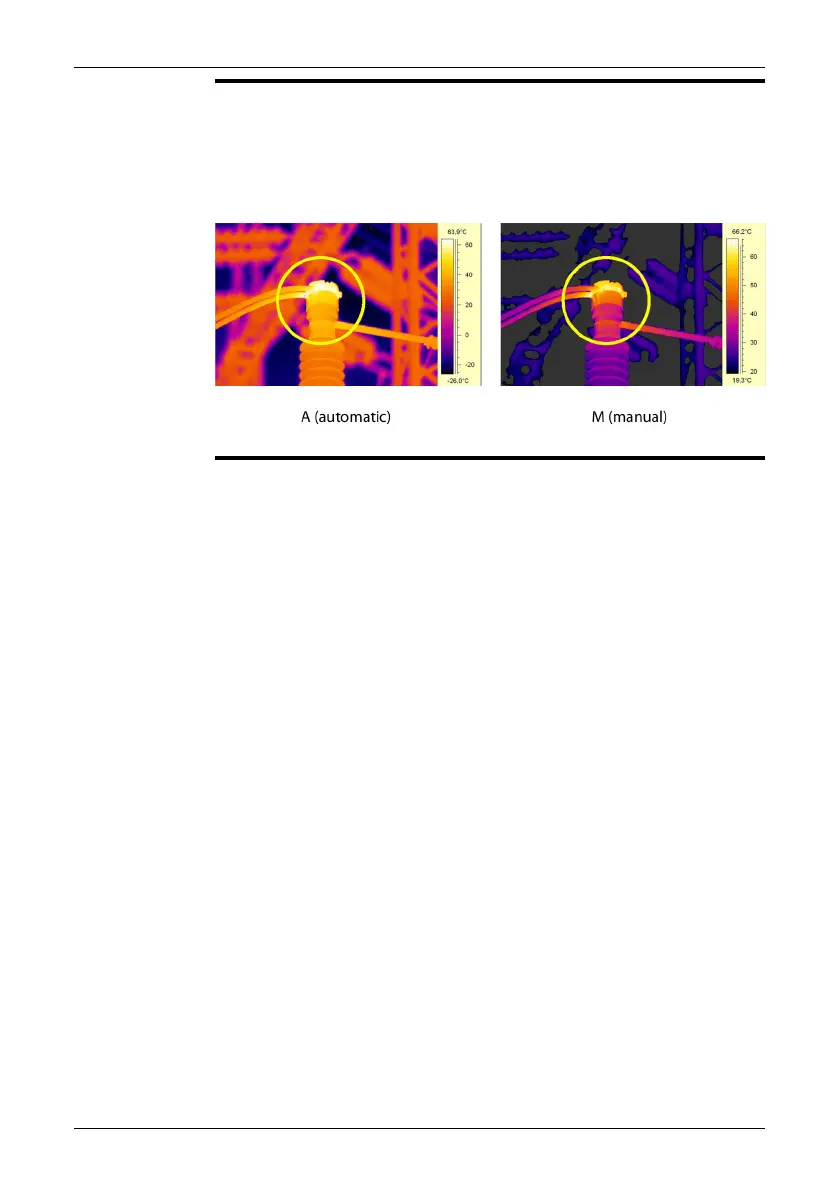
Example 2
This figure shows two infrared images of an isolator in a power line.
In the left image, the cold sky and the power line structure are recorded at a minimum
temperature of –26.0°C (–14.8°F). In the right image the maximum and minimum
temperature levels have been changed to temperature levels near the isolator. This
makes it easier to analyze the temperature variations in the isolator.
10742503;a3
70 Publ. No. 1558792 Rev. a460 – ENGLISH (EN) – July 1, 2010
16 – Working with images and folders

 Loading...