Revision 1 149 9/10/2019
The Events tab (Section 5.8) keeps track of all of the various conditions (alarms, power
on/off, configuration changes, discrete input conditions, etc) that occur as the analyzer runs.
The Event log is primarily used as a troubleshooting aid. If issues start occurring with the
analyzer, looking at the Event Log can help to track down the source of the issue. The Event
Log also gives a record of the types of alarms that have occurred during operation of the
analyzer, and when exactly they occurred. To obtain a full list of all of the Event Log records
from the analyzer, simply press the Read from Device button at the top of the screen.
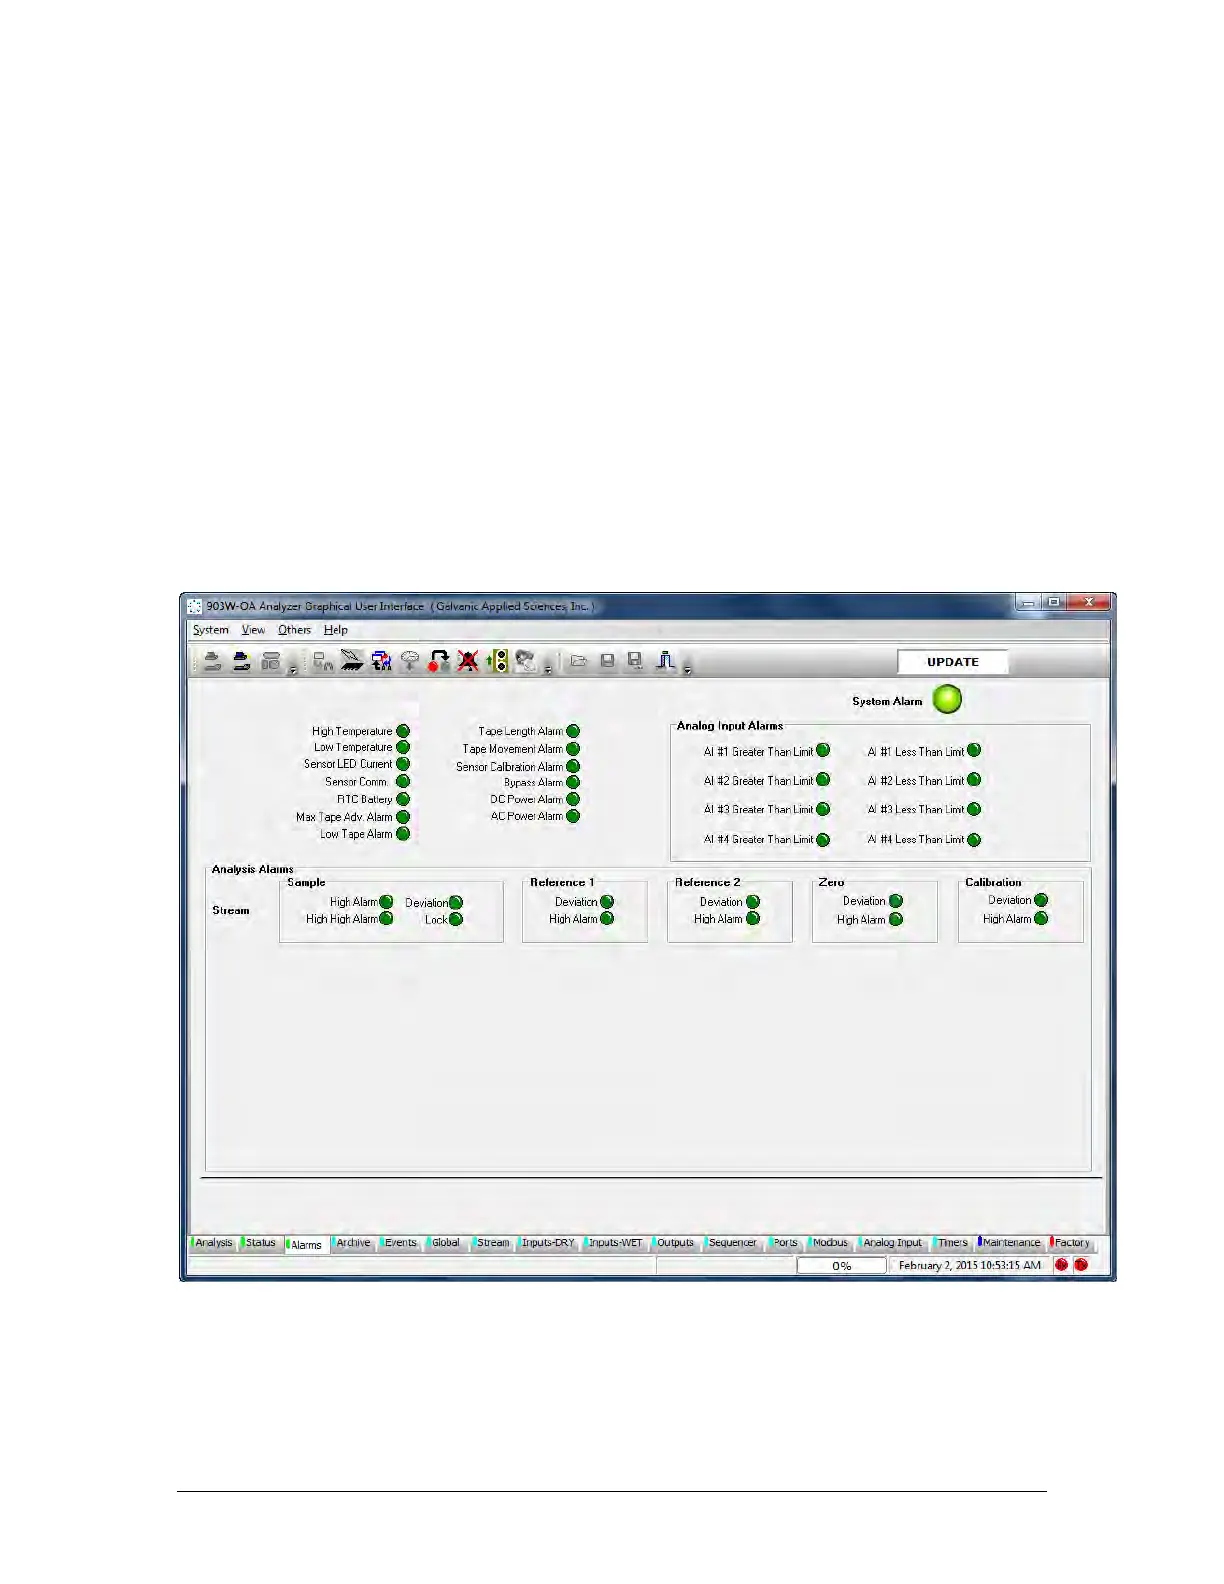
8.3 Alarms Tab
The top left side of the Alarms tab (Figure 8-1) are global alarms defined in Table 8-2. These
non-analysis related alarm parameters affect all streams identically and are related to
hardware and other physical parameters that affect the operation of the analyzer. In many
cases, the set point for these global alarms is user configurable. Each alarm can be
configured to a) be active or not active and b) to trigger certain outputs, either solenoids or
relays.
Figure 8-1: Alarms Tab