Revision 1 83 9/10/2019
5.8 Events Tab
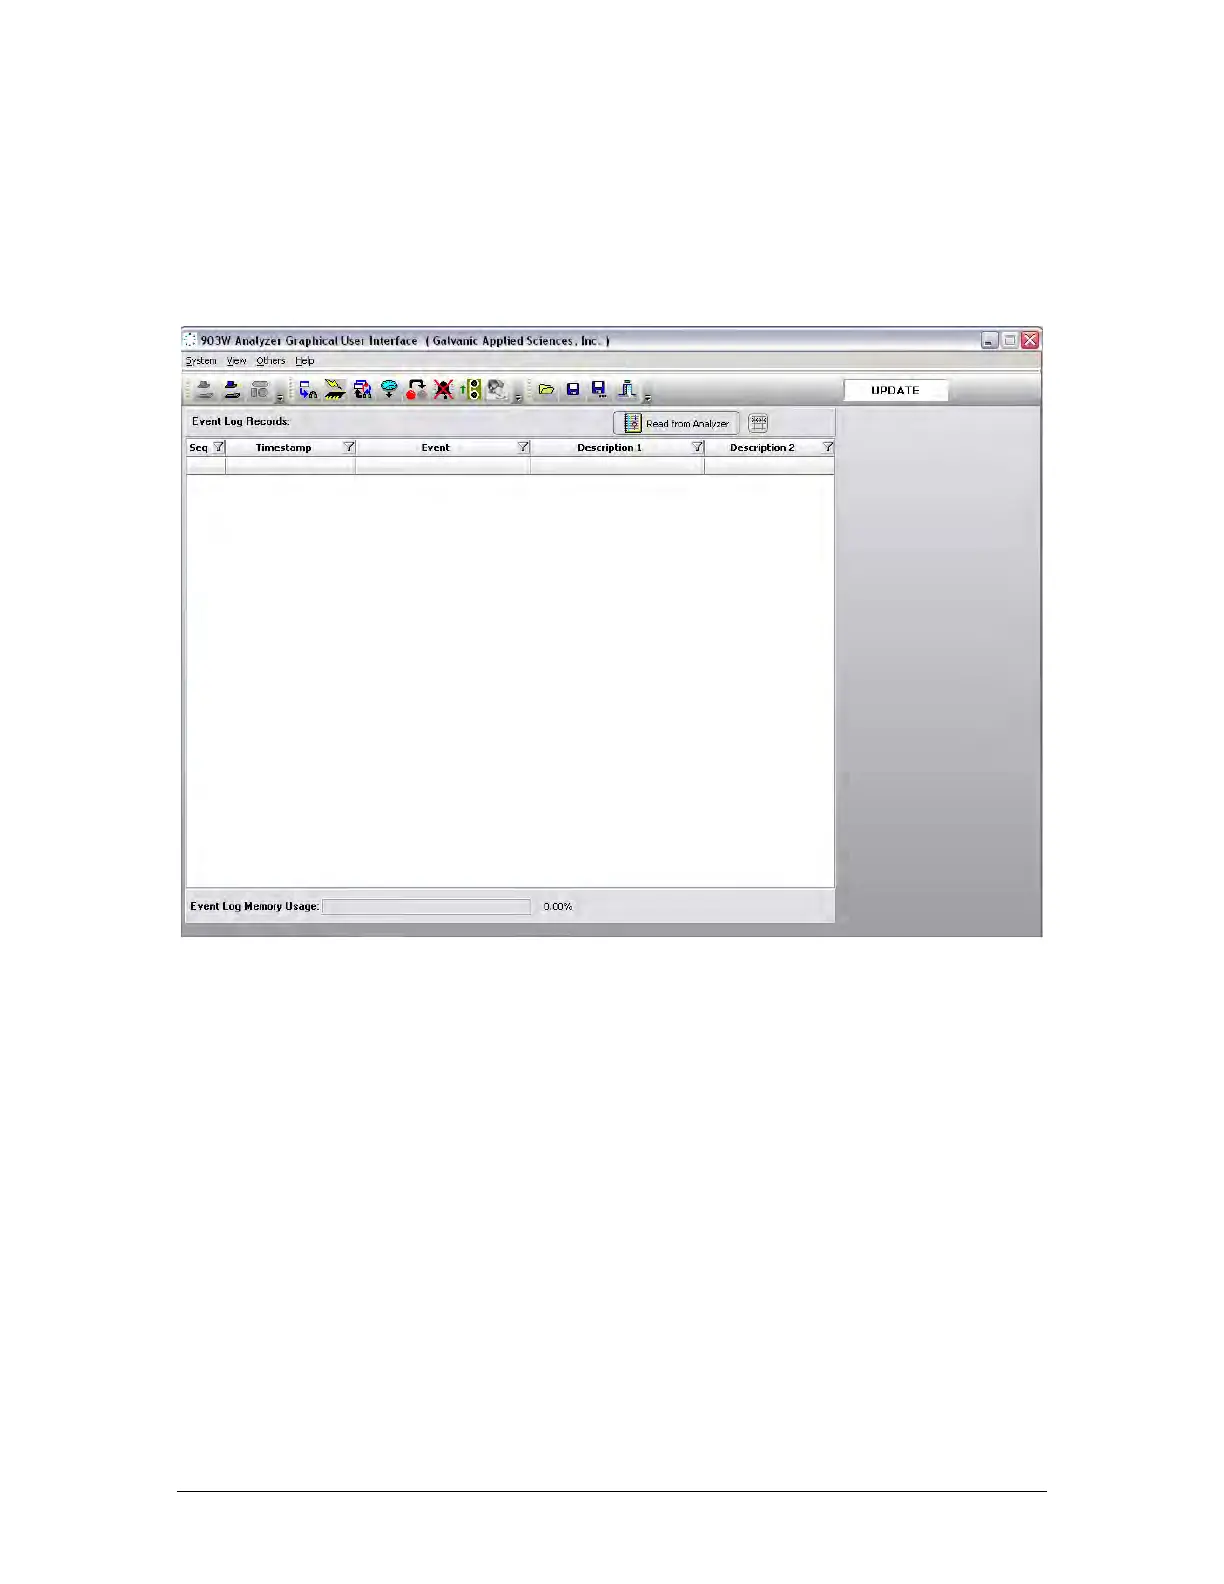
The Events tab (Figure 5-16) contains a list of all of the various conditions (alarms, power
on/off, configuration changes, discrete input conditions, etc. that occur as the analyzer runs
and is primarily used as a troubleshooting aid. The Event Log may be very useful in tracking
down the source of a problem with the system.
Figure 5-16: Events Tab
In addition, the Event Log maintains a record of the types of alarms that have occurred during
operation of the analyzer and the time when the alarm was sent. To obtain a full list of all of
the Event Log records from the analyzer, simply press the Read from Device button at the top
of the screen.
Records in the Event Log can be sorted according to the date, using the same procedure
which was described in Section 5.7 for the Archive tab. Since the Event Log does not contain
numerical data, numerical sorting is not possible, but it is possible to sort it according to the
type of event that caused data to be recorded. As an example, if the user wished to show all
the alarms that had been triggered in the system since it began operating, it is possible to
filter the event column using the parameter =Alarm. This will show all alarms stored in the
Event Log. The Event Log also changes in configuration and power up events.