Revision 1 75 9/10/2019
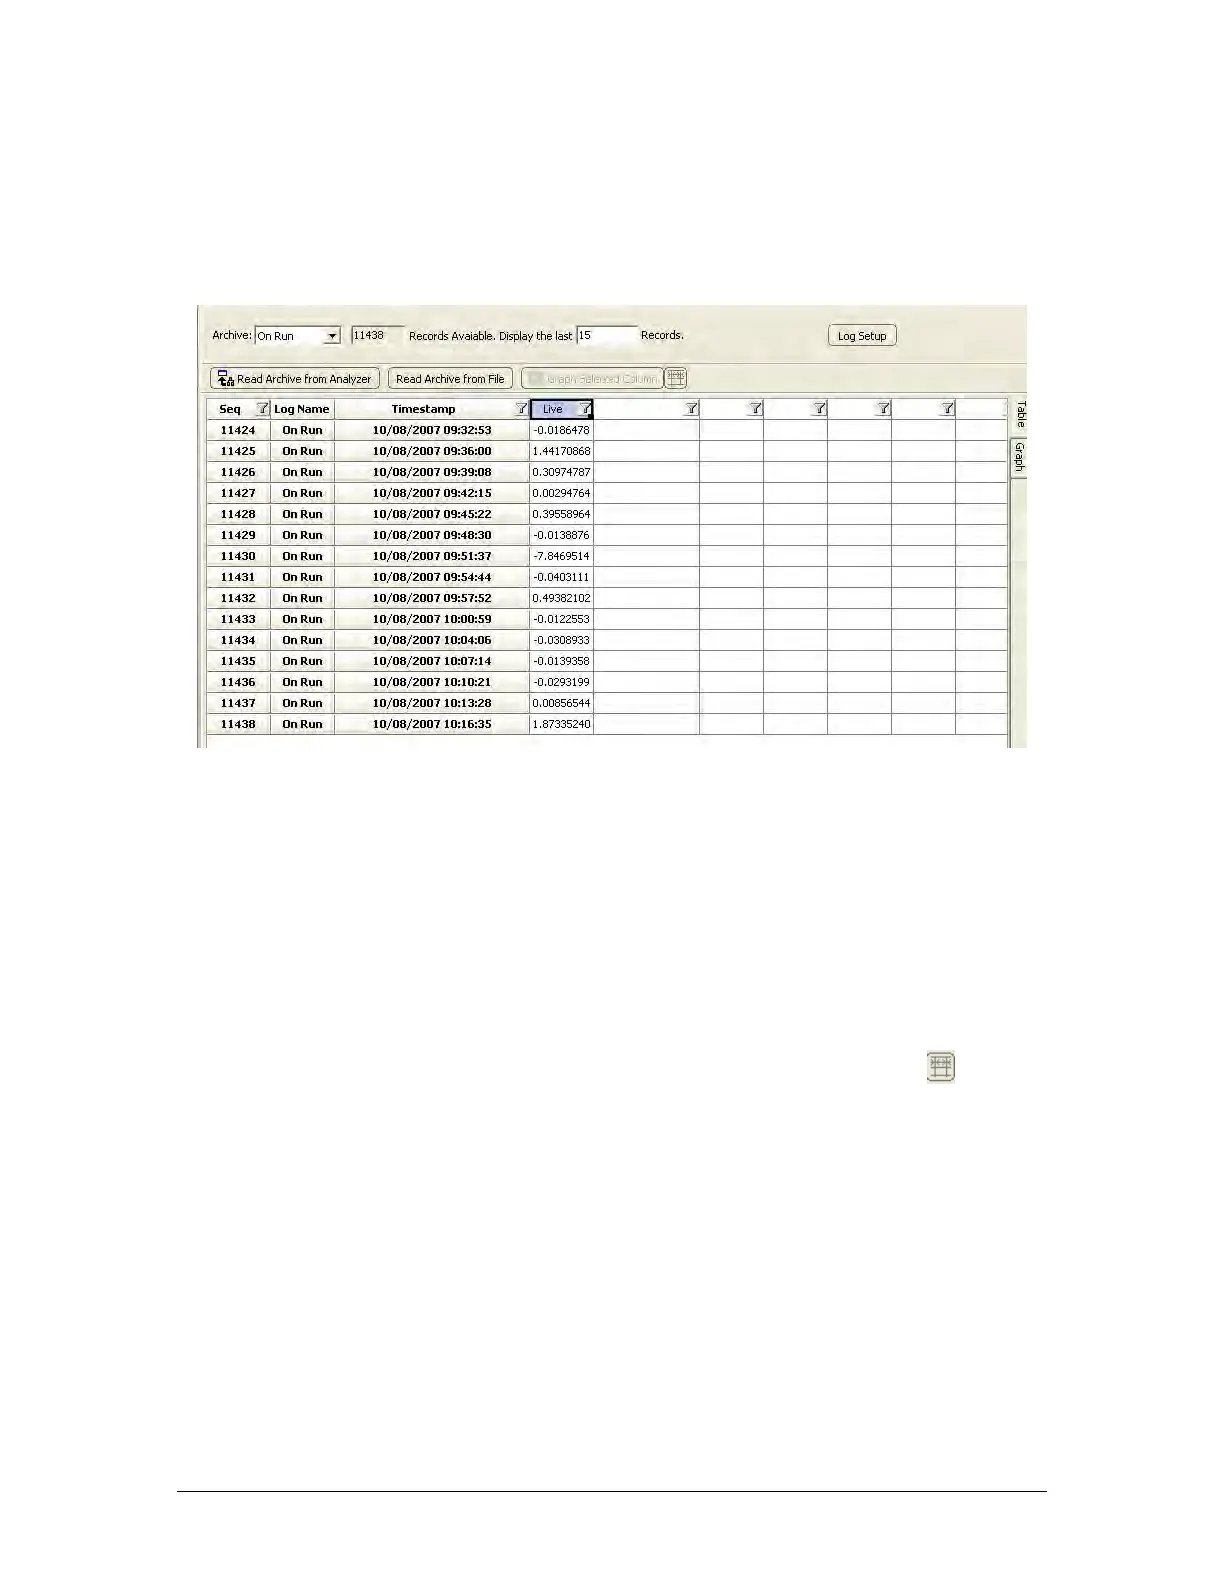
The Archive field at the top left of the screen includes a pull down menu which allows the
user to select which archive should be viewed. The field immediately to the right of this menu
shows how many records are stored in the currently selected archive. To retrieve data from
this archive, enter a value in the Display the last ______ Records field and press the Enter
key on the keyboard. This will pull up the number of records entered in the field, as shown in
Figure 5-11.
Figure 5-11: Archive Window - Data Displayed
• Seq - identifies each data point in a sequential manner.
• Log Name - indicates which log the data came from. This is useful when the data is
exported (Section 5.7.3.3). To look at another log, select the desired log from the pull down
menu adjacent to the Archive indicia. For more information on the various types of logs, see
Section 5.7.3.3.
• Timestamp - shows the date and time when the data in a given row was obtained. To the
right of these grey columns are several white columns containing data. The first row in the
archive has data labels that identify exactly what data is in each column. The column widths
can be automatically scaled to fit the data by pressing the Auto-Size Columns (
) button
at the top of the screen. The archive is set up at the factory to log the data points of the
most interest to operators, though the archive is fully configurable to log many more data
points – see section 0.
5.7.2 The Graph Format
The data in the white columns can be graphed by right clicking and dragging down to select
the desired portion of a given data column. Once the data of interest has been selected, click
on the Graph Selected button at the top of the screen. This will create a graph that shows the
trend in the selected data (e.g. Figure 5-12).