Revision 1 76 9/10/2019
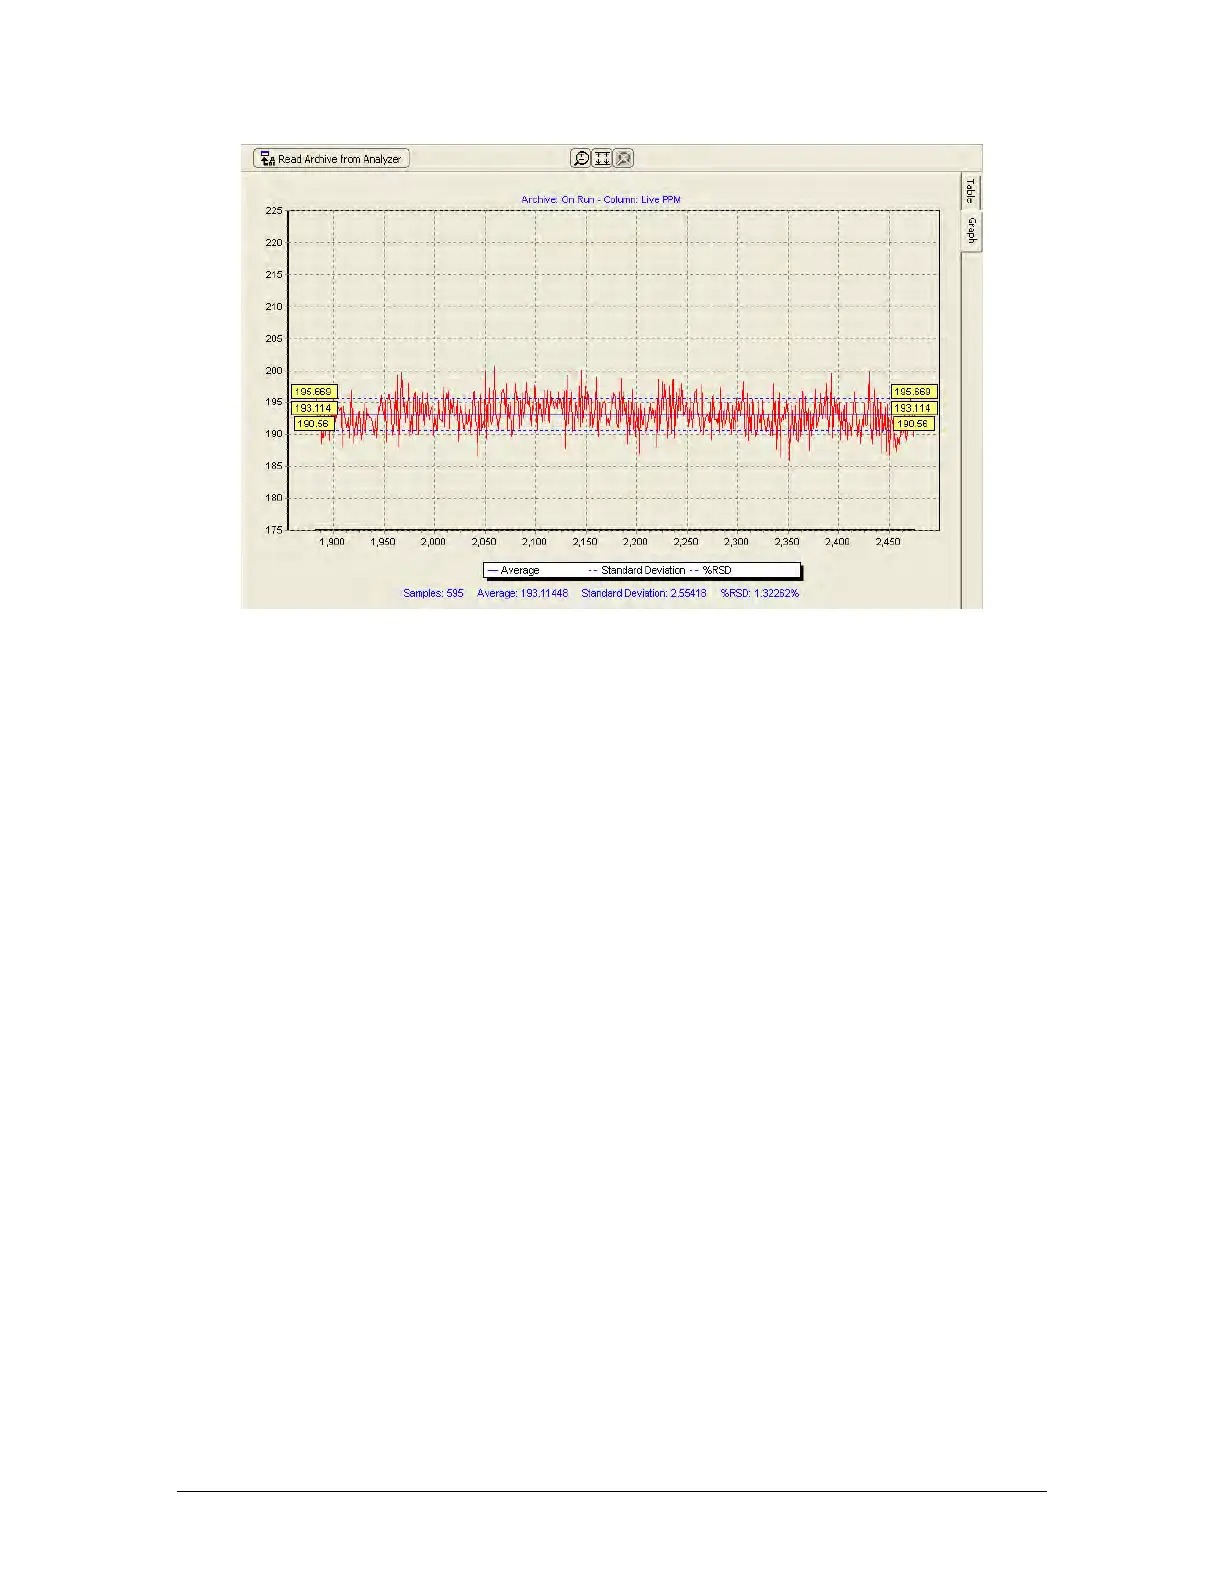
Figure 5-12: Charted Data
There are 3 blue dashed lines on the graph:
• The solid blue line in the middle shows the average of the selected data,
• The 2 dashed blue lines above and below the central line show one standard deviation
away from the mean in both directions.
The yellow boxes at either end of the plot adjacent to solid blue line contain the numerical
value of the average.
The yellow boxes at either end of the plot adjacent to the dashed blue line above the average
contain the numerical value of the average plus 1 standard deviation, and the yellow boxes at
either end of the plot adjacent to the dashed blue line above the average contain the
numerical value of the average minus 1 standard deviation.
The numerical values of the statistics presented below the chart include the number of data
points (samples), the average, the standard deviation, and the standard deviation, in percent,
relative to the average.
The three buttons on the chart window are described in Table 5-7.