Revision 1 77 9/10/2019
Table 5-7: Chart Button Functions
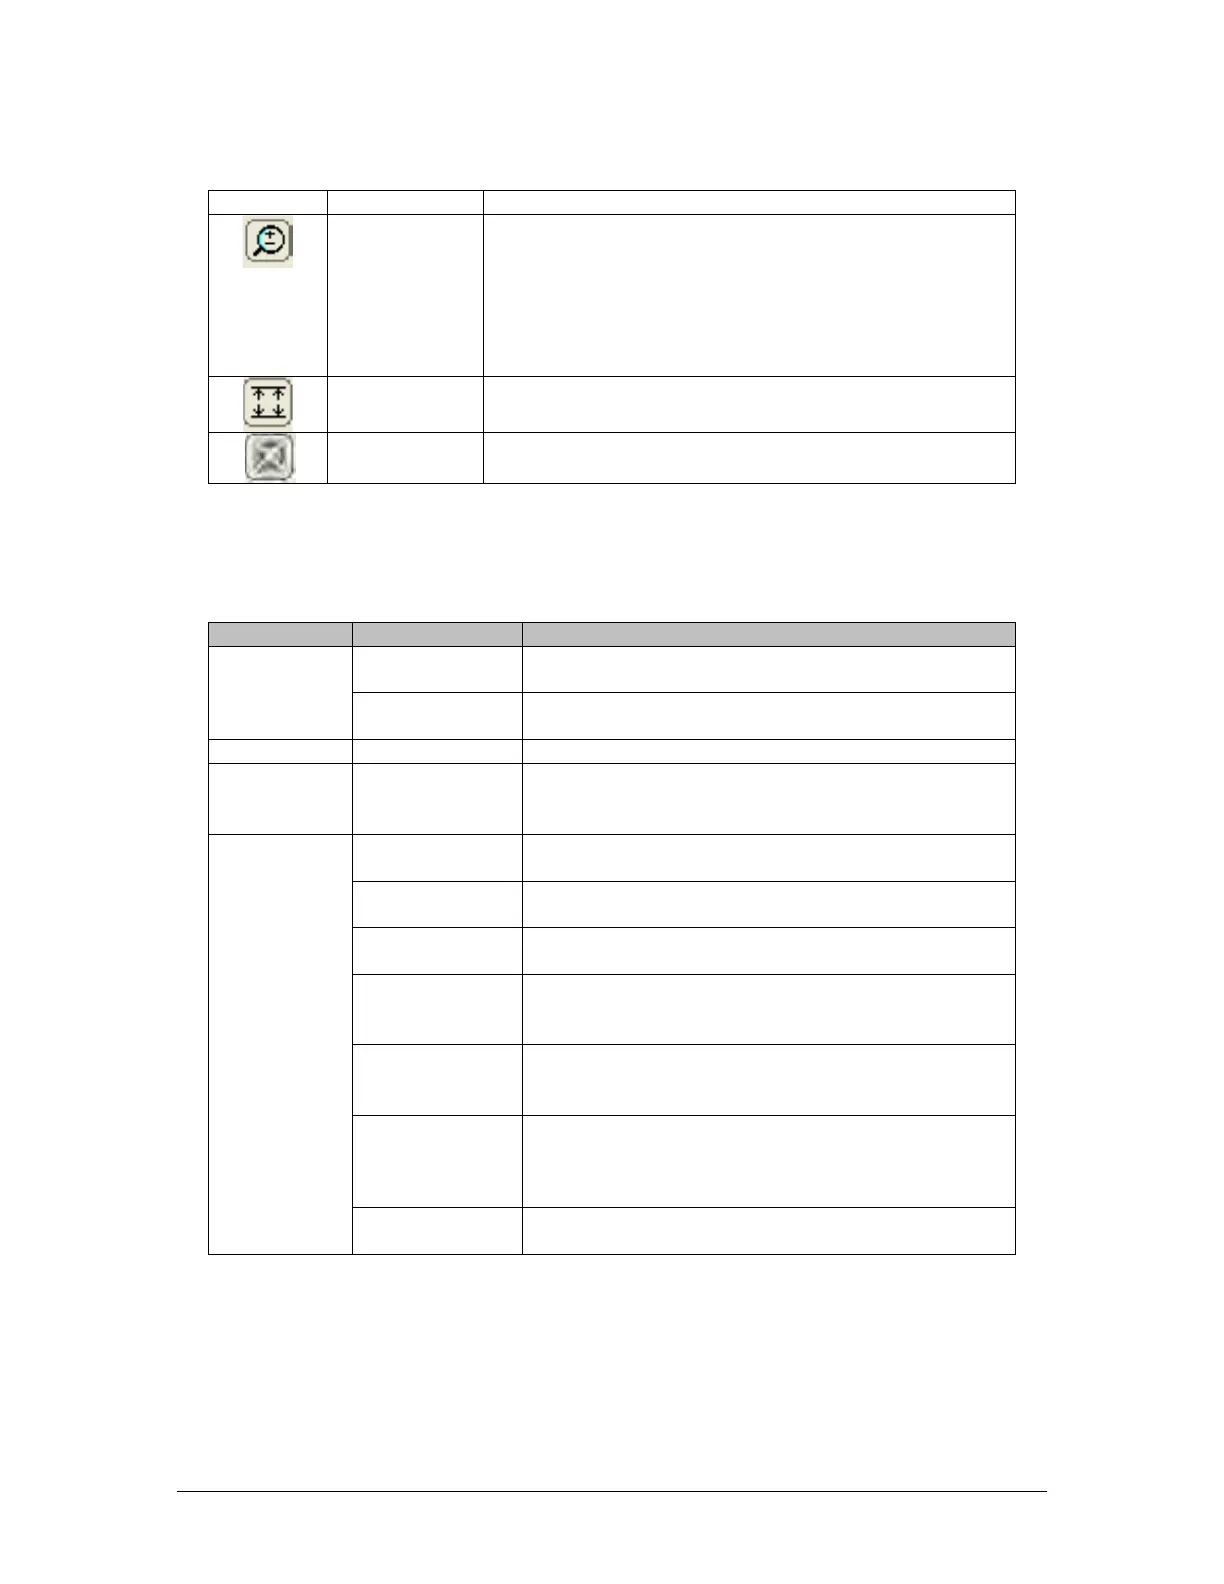
Toggles Zoom mode on and off. When the button is
clicked, left clicking on the chart will zoom in on a section
of the chart, centered on the clicked location. Right
clicking will zoom out on a section of the chart, again
centered on the clicked location. When zoomed in on the
data, the user can scroll left, right, up and down using the
arrow keys on the computer keyboard.
Automatically adjusts the y-axis scale so that all data
within the zoomed in selection can be seen.
Graph
Cancels all zooms and returns to the auto-scaled graph
originally produced when the data was first graphed.
A pop-up menu with the functions indicated in Table 5-8 can be accessed by right clicking on
the chart.
Table 5-8: Chart Manipulation Options
Scales the y-axis to the data. This is the default
scaling when a graph is first made.
Brings up a dialog box that allows the user to set the
minimum and maximum value for the y-axis scale.
Prints the chart to the printer of the user’s choice
Clipboard
Copies the chart to the clipboard as an image to
allow the user to paste it into another application,
®
Allows the user to set the colours used for both the
data and the statistics lines on the chart.
Allows the user to set the chart’s background colour.
Resets all colours to their defaults: red for data, blue
for statistics, and grey for the background.
When this option is selected, inverts the function of
the arrow keys while zoomed in on data (i.e. down
key moves up, left moves right, etc).
Allows the operator to select whether the chart will
be printed in landscape or portrait mode. The default
Allows the operator to select whether the printed
chart will be scaled to fit the selected size of paper,
or kept in the on-screen proportions. The default is
Toggles statistics labels on the chart on and off. The
default is on.