Revision B 120 Series Maternal/Fetal Monitor 4-75
2015590-001
Theory of Operation: MSpO2 Board
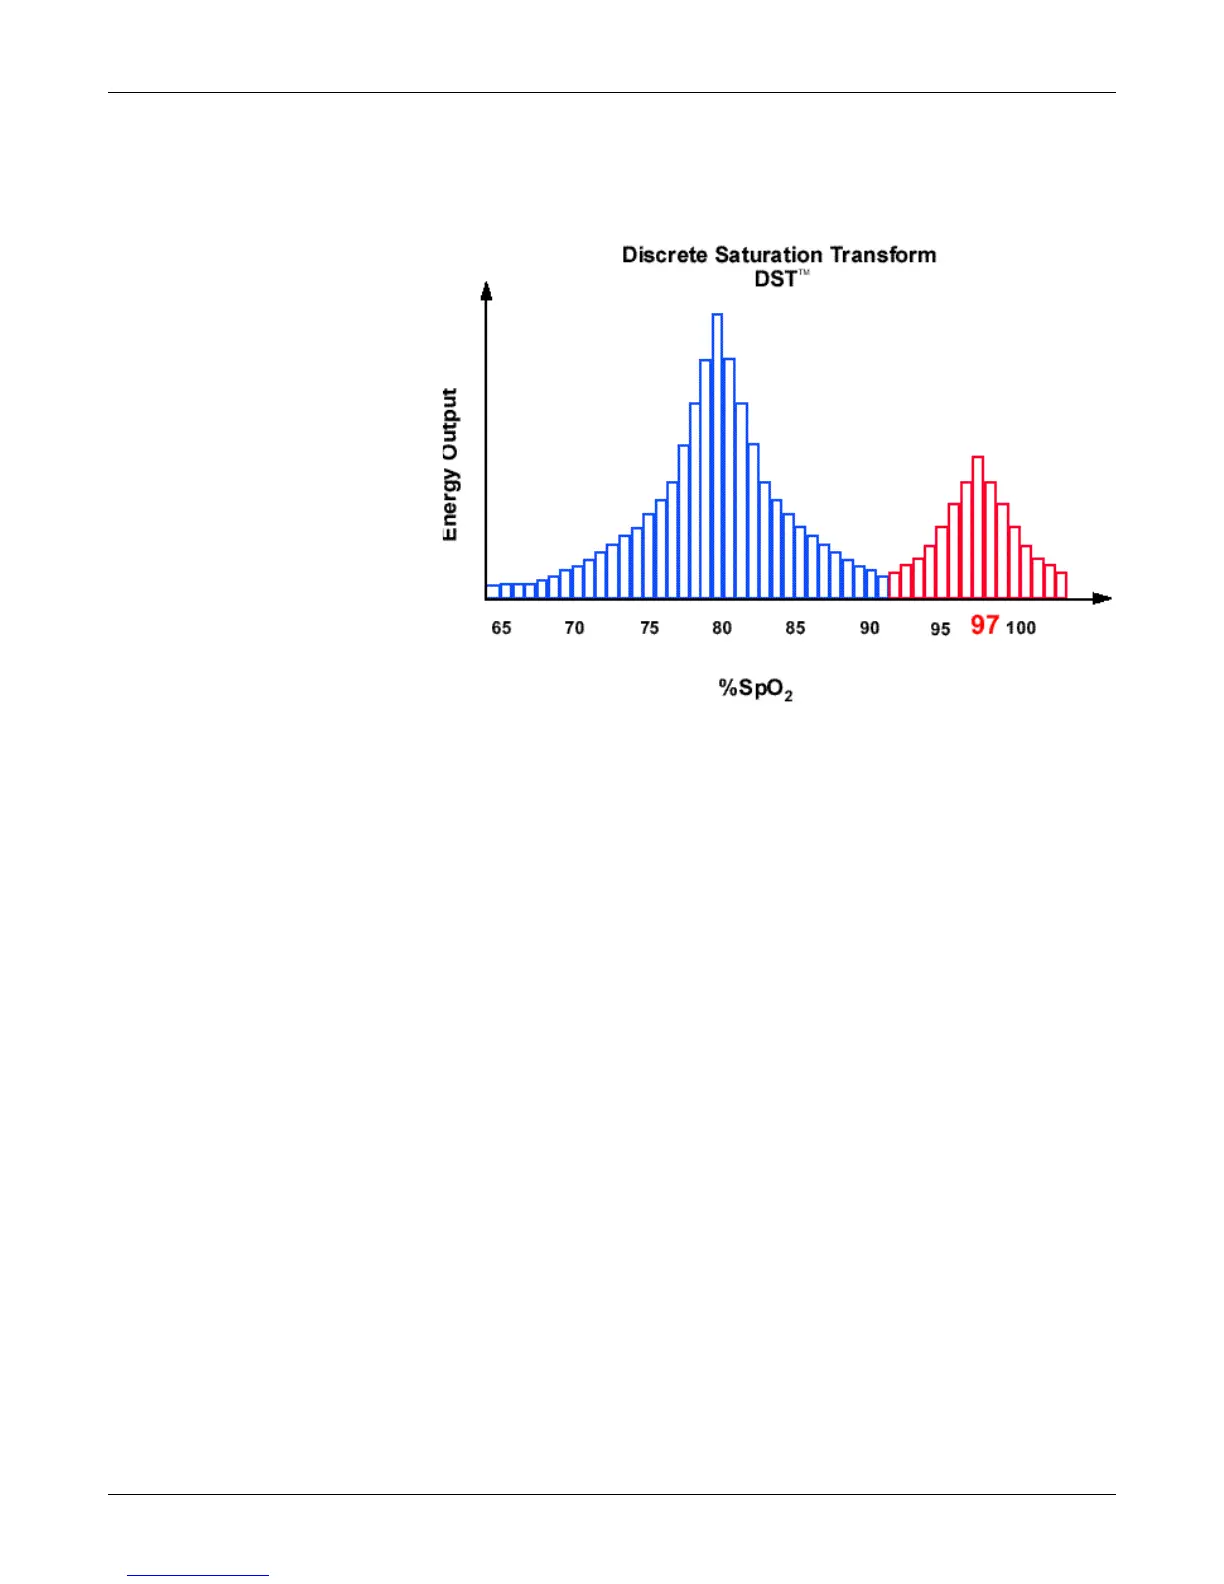
relative output power versus possible SpO2 value as shown in the following figure
where R corresponds to SpO2 = 97%:
The DST plot has two peaks: the peak corresponding to the higher saturation is
selected as the SpO2 value. This entire sequence is repeated once every two seconds
on the most recent four seconds of raw data. The MS-5 SpO2 therefore corresponds
to a running average of arterial hemoglobin saturation that is updated every two
seconds.
 Loading...