Lens Characteristics and Specifi cations 239
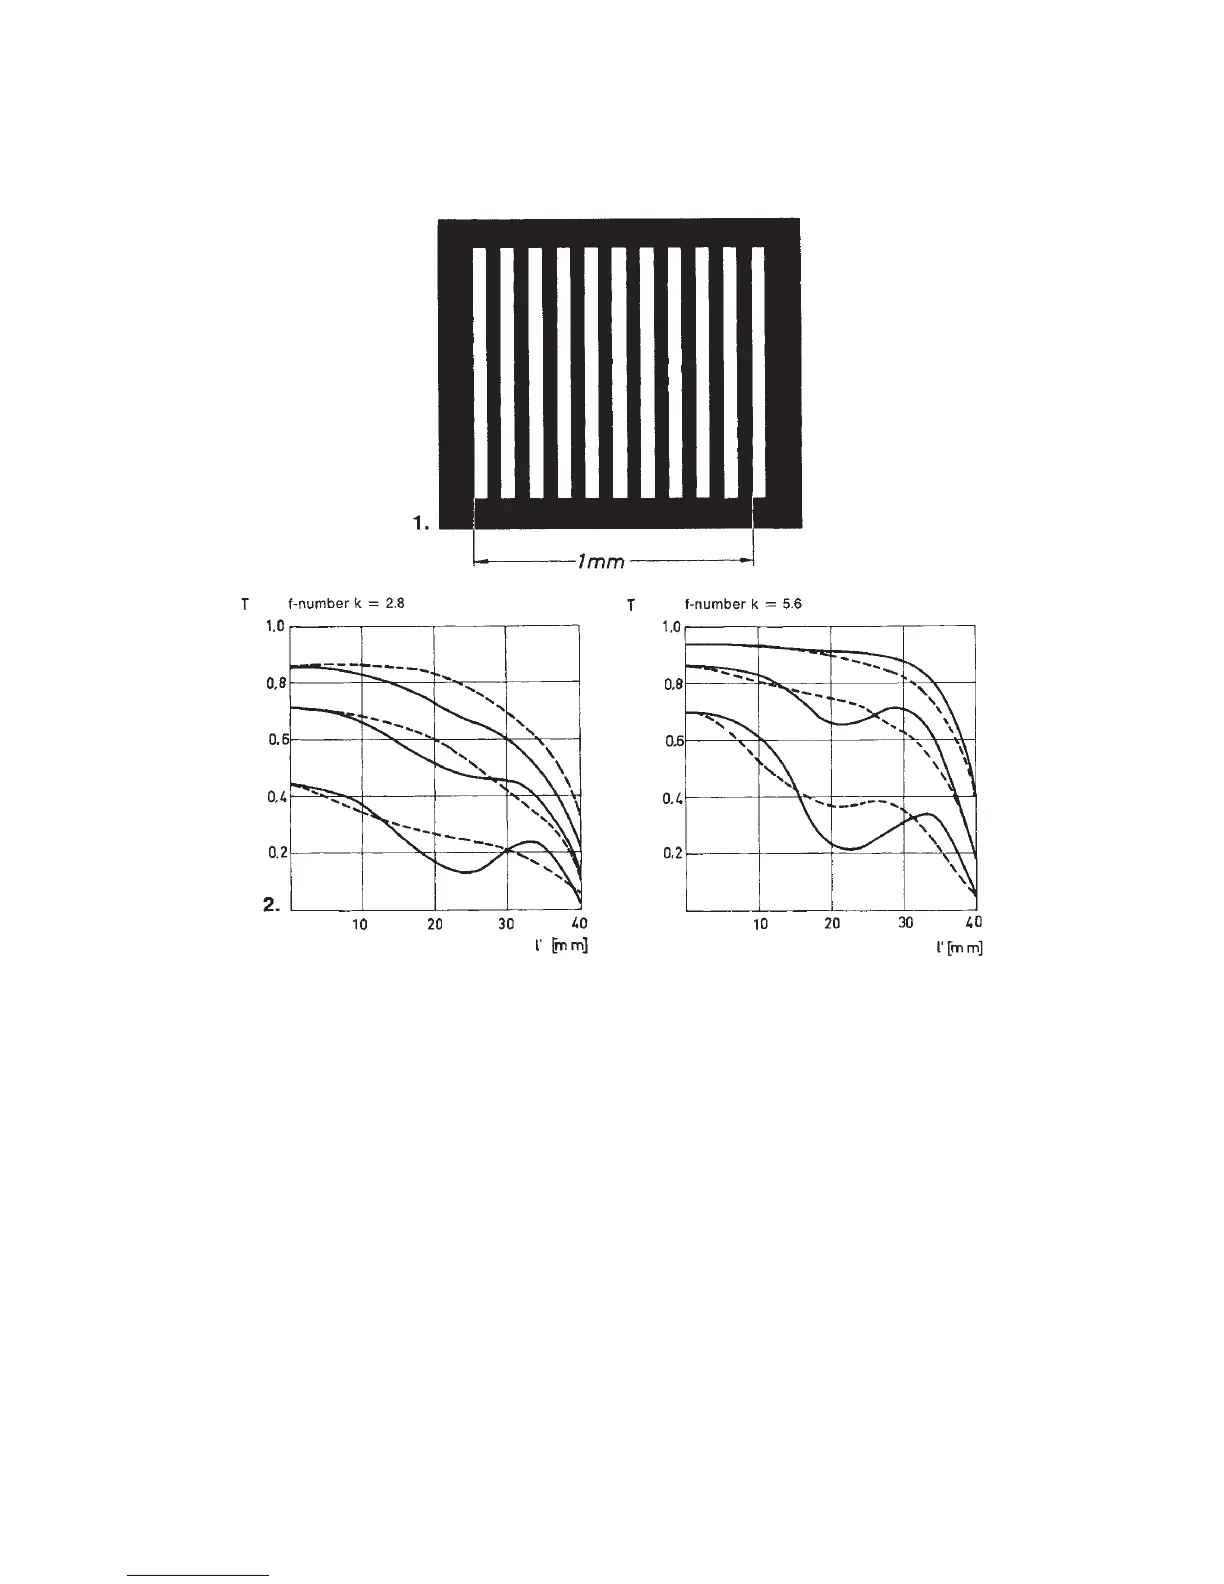
The performance is illustrated with three sets of lines for different resolution fi gures with the
top line (or the two top lines) the most important for general photography. The higher the lines,
the better the lens. The dotted curve is for tangential lines and the solid curve for sagittal lines.
Figure 14-4 shows MTF diagrams for the HC 3.2/150 mm and the HC4/120 mm lens.
The Hasselblad MTF diagrams cannot be used to compare the Hasselblad lenses to those
made by other companies because there are no standards within the industry. Most compa-
nies publish these diagrams based solely on computer printouts not taking into account the
manufacturing precision. The charts for the Hasselblad lenses show the actual performance
of the lens that is on your camera or the camera that you plan to purchase.
Figure 14-3 MTF diagrams. (1) The quality of a photographic image is not determined by the
number of lines that are resolved but by the edge sharpness, which is called acutance.
(2) On the MTF diagrams, the image height is on the horizontal axis with the center at the
left. The diagrams are shown with the aperture wide open (left) and stopped down about
two aperture values (right).