6.1 Using the TIME PLOT Screen
80
Screen operations depending on the internal operation status
When measurement starts, the time series graph is displayed on the
TIME PLOT screen.
The Y-axis and X-axis are automatically scaled so that all the time
series graphs are displayed on the screen.
To change the scale of the Y-axis or X-axis, end measurement.
When measurement stops, the time series graph is no longer dis-
played.
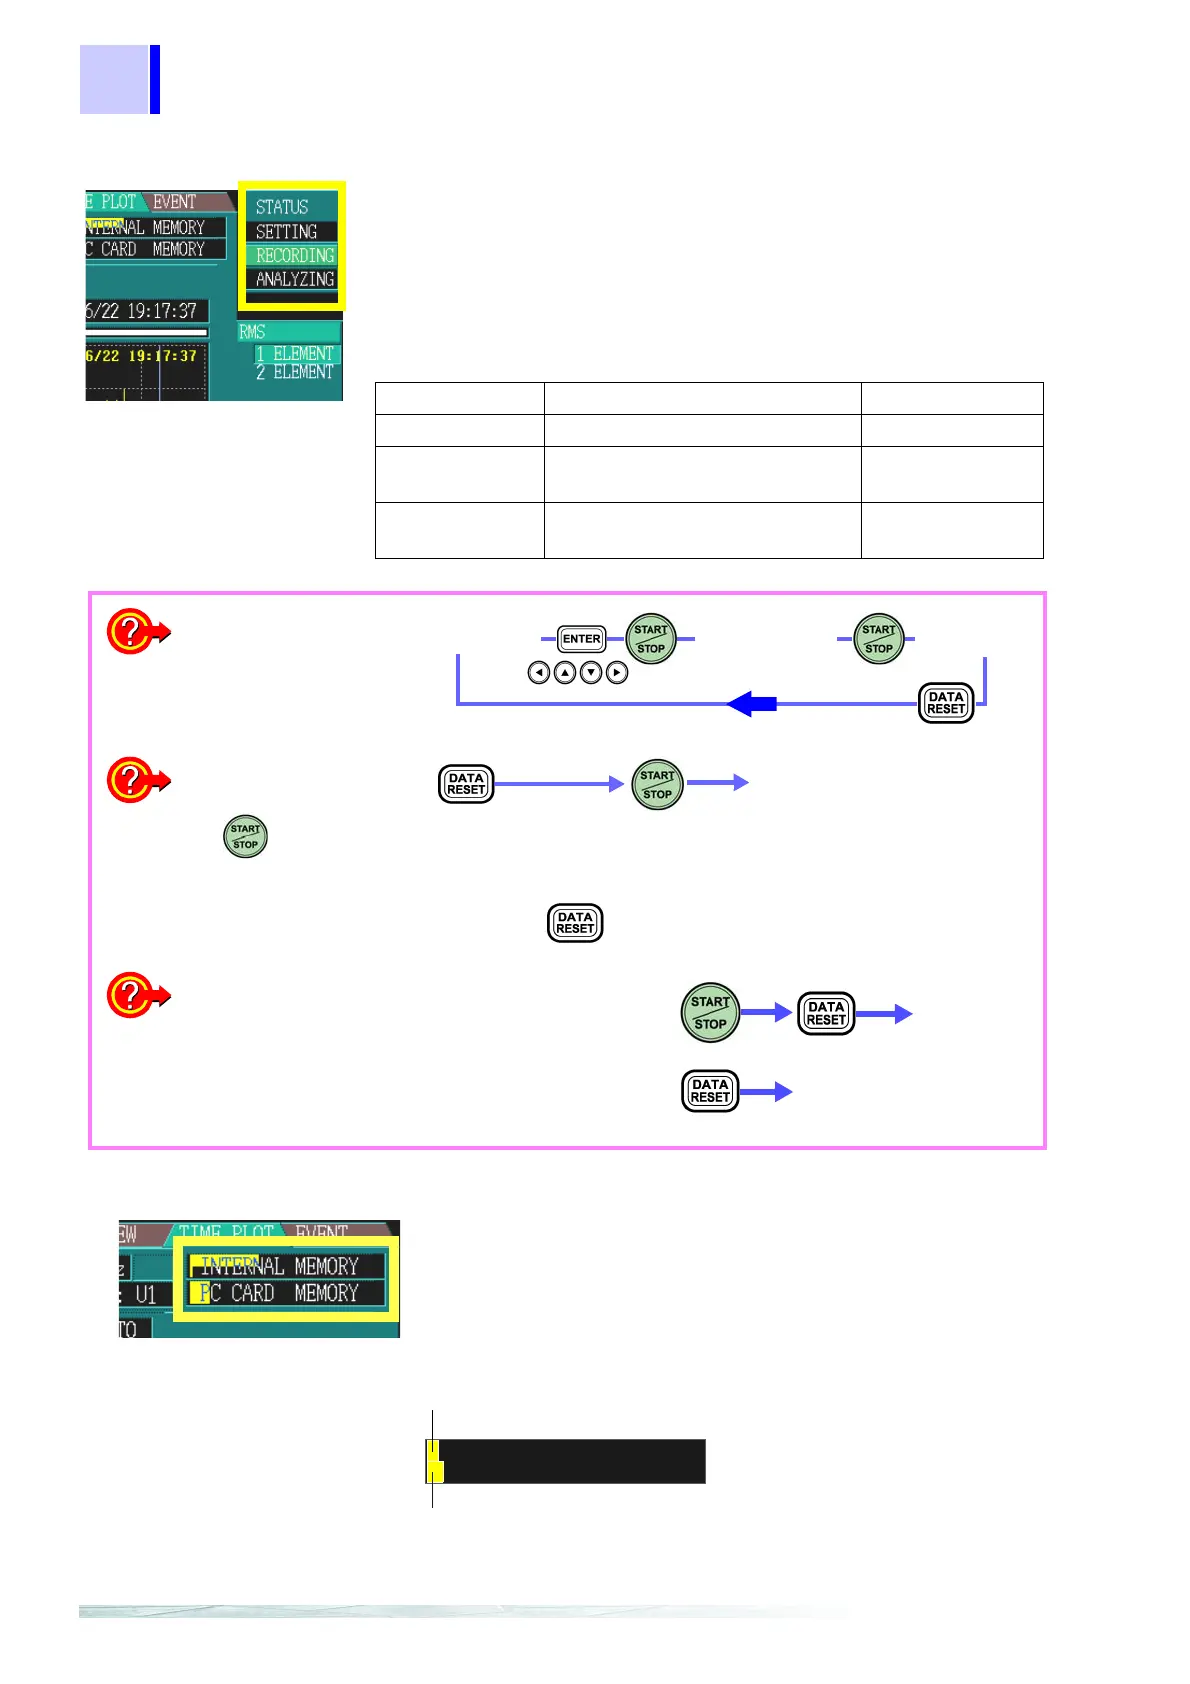
Memory status display
Status Display Display update
[SETTING] No time series graph display data. -----------
[RECORDING] The time series graph display is
updated.
At each set interval
[ANALYZING] The time series graph display is
stopped.
-----------
What is the relationship
between the operation status
and key operations?
The key does not
start recording during
[ANALYZING] operation!
Changing settings while
[RECORDING] or [ANALYZ-
ING]
is displayed?
In either case, data stored in internal memory is erased.
[RECORDING]
[ANALYZING
SETTING]
Return to the setting
mode from analysis
Start recording
[RECORDING]
CAUTION!
Pressing erases all data stored in internal memory.
[SETTING
uring [RECORDING]
peration:
operation:
[SETTING]
INTERNAL MEMORY: Internal memory
PC CARD MEMORY: ATA flash card
INTERNAL MEMORY
TIME PLOT related data capacity
Measurement stops when memory becomes full.
(Selectable Stop/Continuous)
Up to 100 EVENT data sets can be stored
After 100 events are stored, the earliest are overwritten.