6.6 Flicker
107
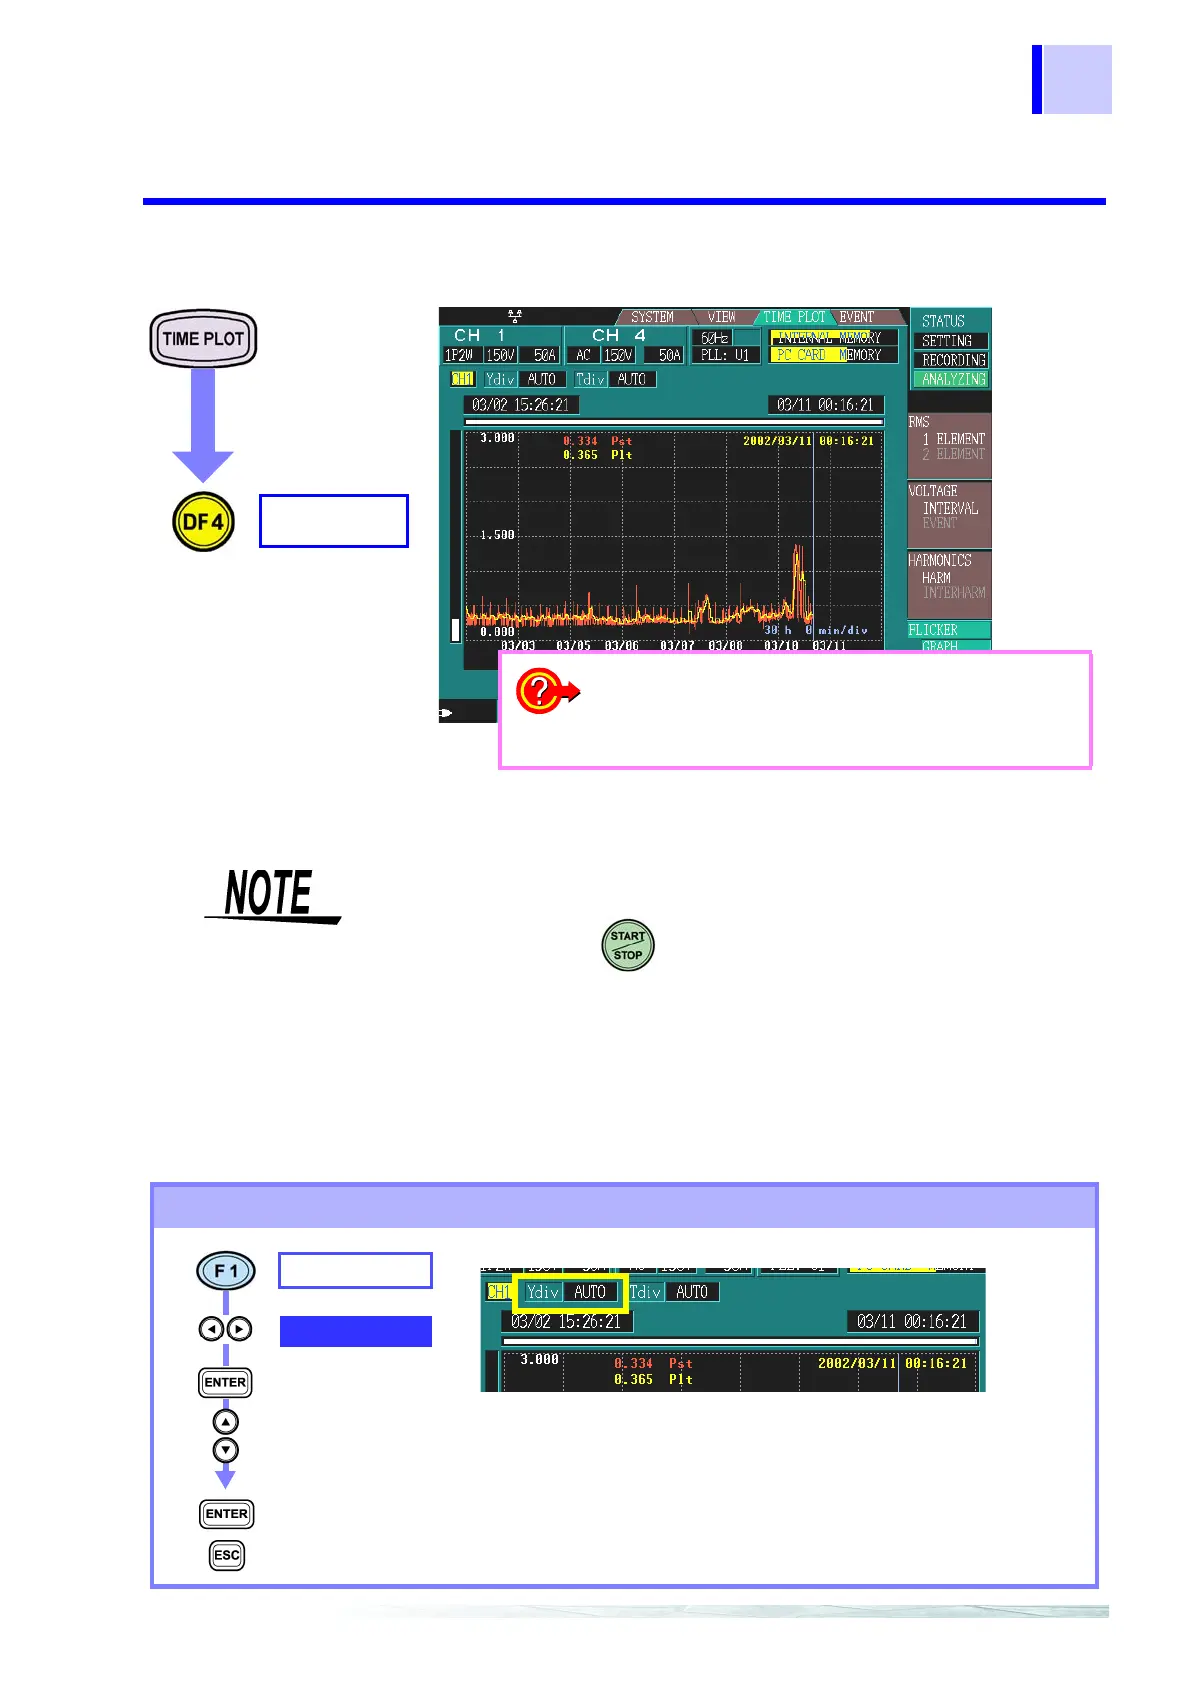
6.6.2 IEC Flicker Graph
Displays the IEC flicker graph.
GRAPH
FLICKER
❖ Changing the Y-axis scale (page 107)
❖ Changing the X-axis scale (page 108)
❖ Cursor measurements (page 108)
❖ Scrolling through waveforms (page 109)
• The graph is updated every 10-minute, regardless of the interval that is
set for
[SYSTEM]-DF2[MAIN]-[RECORDING].
• After you press , the clock displays “00” seconds and measure-
ment starts.
• This is only displayed if Pst,Plt is selected for Flicker in
[SYSTEM]-
DF2[MAIN]-[MEASURE]
.
• A fluctuation graph of S(t) is displayed in the DF2[VOLTAGE]
screen. However, this graph is not displayed unless S(t) is selected
for voltage recording with [SYSTEM]-DF2[MAIN]-[MEASURE].
Changing the Y-axis scale
SELECT
Ydiv
Select from pull-
down menu
Confirm
Cancel
AUTO, x1, x2, x5, x10, x25, x50
When you want to reduce the graph, make the scale smaller.
When you want to enlarge the graph, make the scale larger.
AUTO scaling is used during recording.