6.2 Time Plot Settings
81
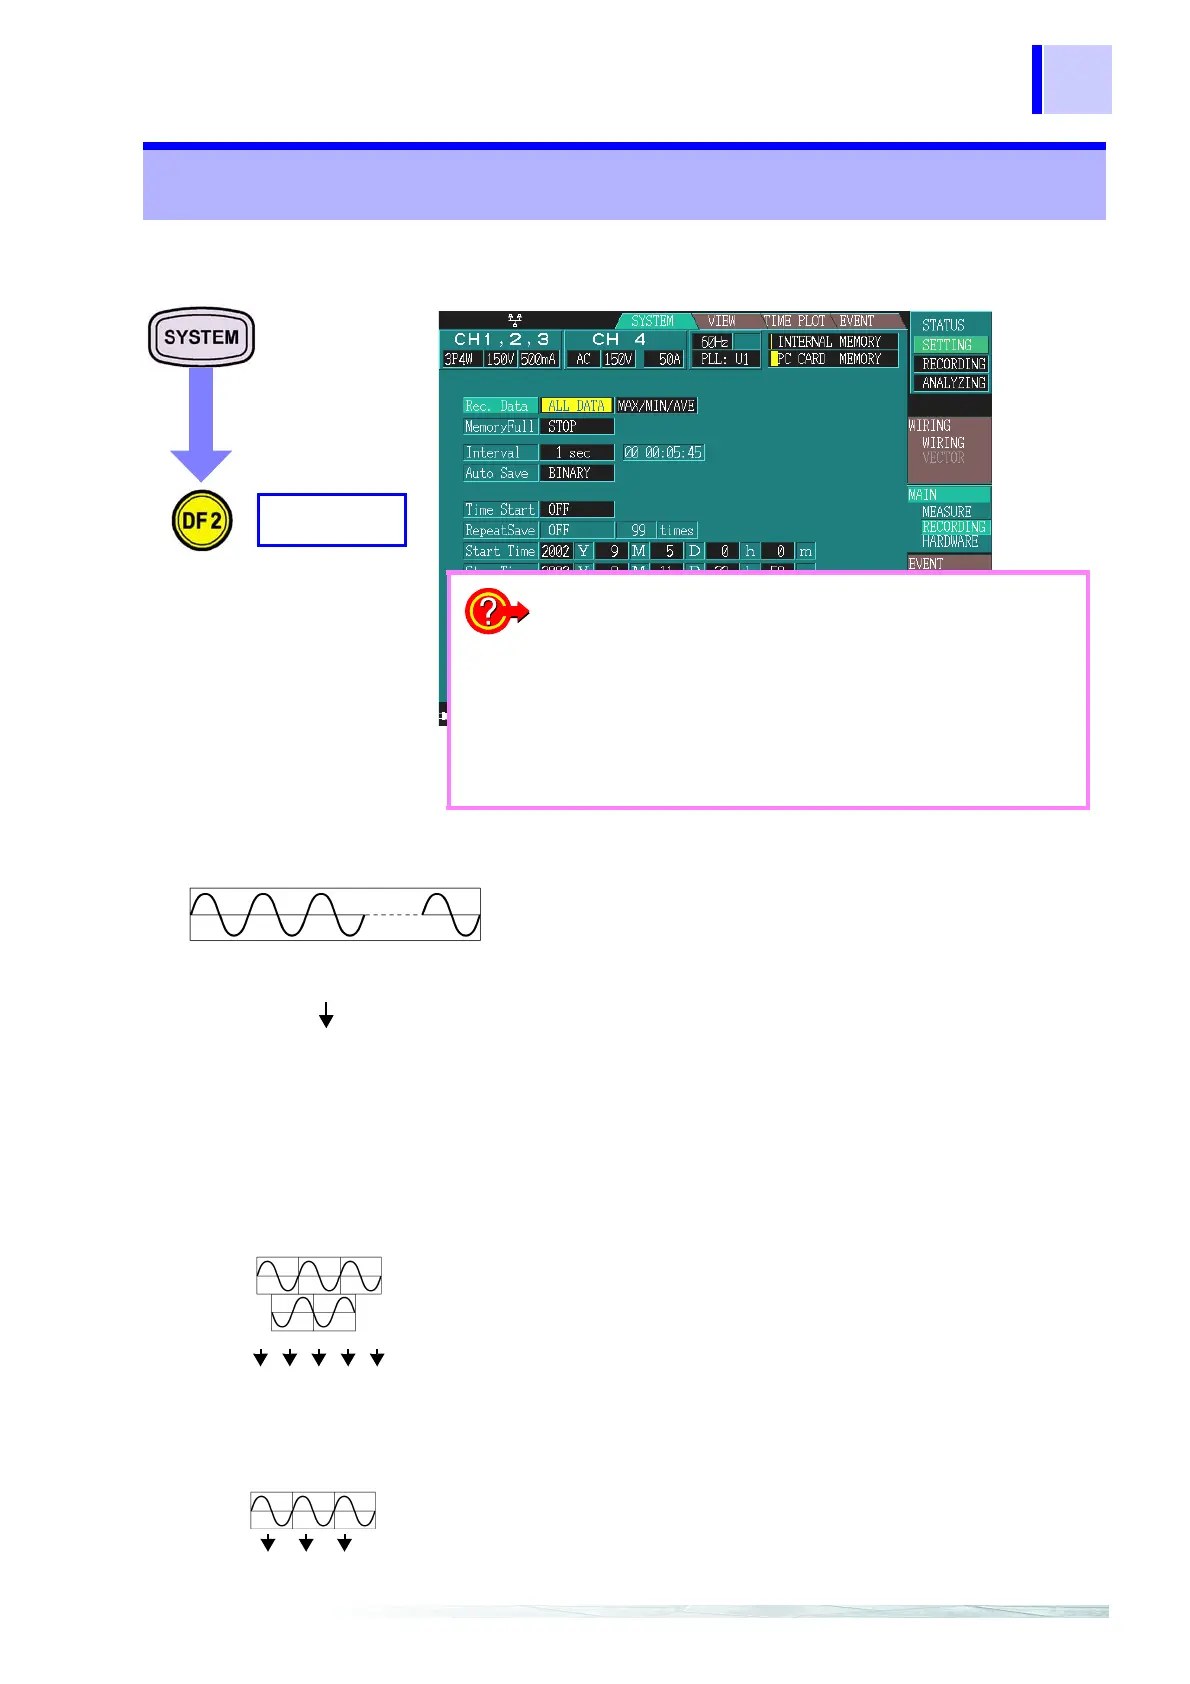
To display the time series graph, make the following settings in the
SYSTEM screen.
6.2 Time Plot Settings
MAIN
RECORDING
❖ Types of settings to record data 1 (page 82)
❖ Types of settings to record data 2 (page 83)
❖ Settings when the memory is full (page 83)
❖ Setting intervals (page 84)
❖ Setting Auto-save (page 85)
❖ Setting real-time control (page 85)
❖ Setting measurement start/stop time (page 86)
❖ Setting the repeated recording (page 87)
❖ Setting the number of repeated recording (page 88)
You can display all recorded RMS values with voltage
(calculated for a single half cycle-shifted waveform) and
flicker excluded.
These RMS values are based on calculations that are
performed every 200 ms.
Based on these values, you can record the MAX, MIN
and AVE within the interval period, or the AVE by itself.
Example:
When the interval is set to 1 sec, 5 calculations are per
formed in the 1-second interval. From these, the MAX
MIN, and AVE or the AVE by itself are recorded.
135
24
50 Hz:10 waveforms, 60 Hz:12 waveforms,
400 Hz: 80 waveforms
RMS calculation
Harmonic calculation
Voltage RMS calculation
Time series graph for TIME PLOT-DF1[RMS], TIME PLOT-DF3[HARMONICS]:
Time series graph for TIME PLOT-DF2[VOLTAGE]:
You can display recorded voltage (value calculated fo
one waveform shifted over half a wave).
When measuring at 50 Hz or 60 Hz, since this voltage i
calculated for each single half cycle-shifted waveform,
contains a calculated value for every half cycle.
When measuring at 400 Hz, this voltage value is calcu
lated from a full cycle.
Based on these values, you can record the MAX an
MIN within the interval period.
Example:
When the interval is set to 1 sec, 100 calculations ar
performed in the 1-second interval for 50 Hz current. O
these, only the MAX and MIN values are recorded.
❖ Recording method of Timeplot graph: (page 215)
1 2 3 4 5
At 50 Hz or 60 Hz measurement
135
Voltage RMS calculation
At 400 Hz measurement