6.4 Changes in Voltage
93
6.4.1 Graphing Voltage Fluctuations for Each
Interval
You can display interval-by-interval time series graphs of voltages
(
ΔU,S(t) as well as Urms) internally calculated from single half cycle-
shifted waveforms
• When Urms is selected as the voltage recording setting
(SYSTEM-DF2[MEASURE]):
The RMS voltage detected for swell, dip, and interruption is dis-
played.
The cursor value of the event marker area on the time series graph
is the same as the swell, dip, or interruption value.
• When Pst, Plt is selected
The instantaneous flicker defined in IEC 61000-4-15 is displayed.
• When Δ U is selected as the voltage recording setting
(SYSTEM-DF2[MEASURE]):
The deviation in RMS voltage to nominal voltage (positive and neg-
ative voltage waveform peaks for nominal voltage) is displayed.
MAX and MIN indicate the maximum and minimum during the interval.
6.4 Changes in Voltage
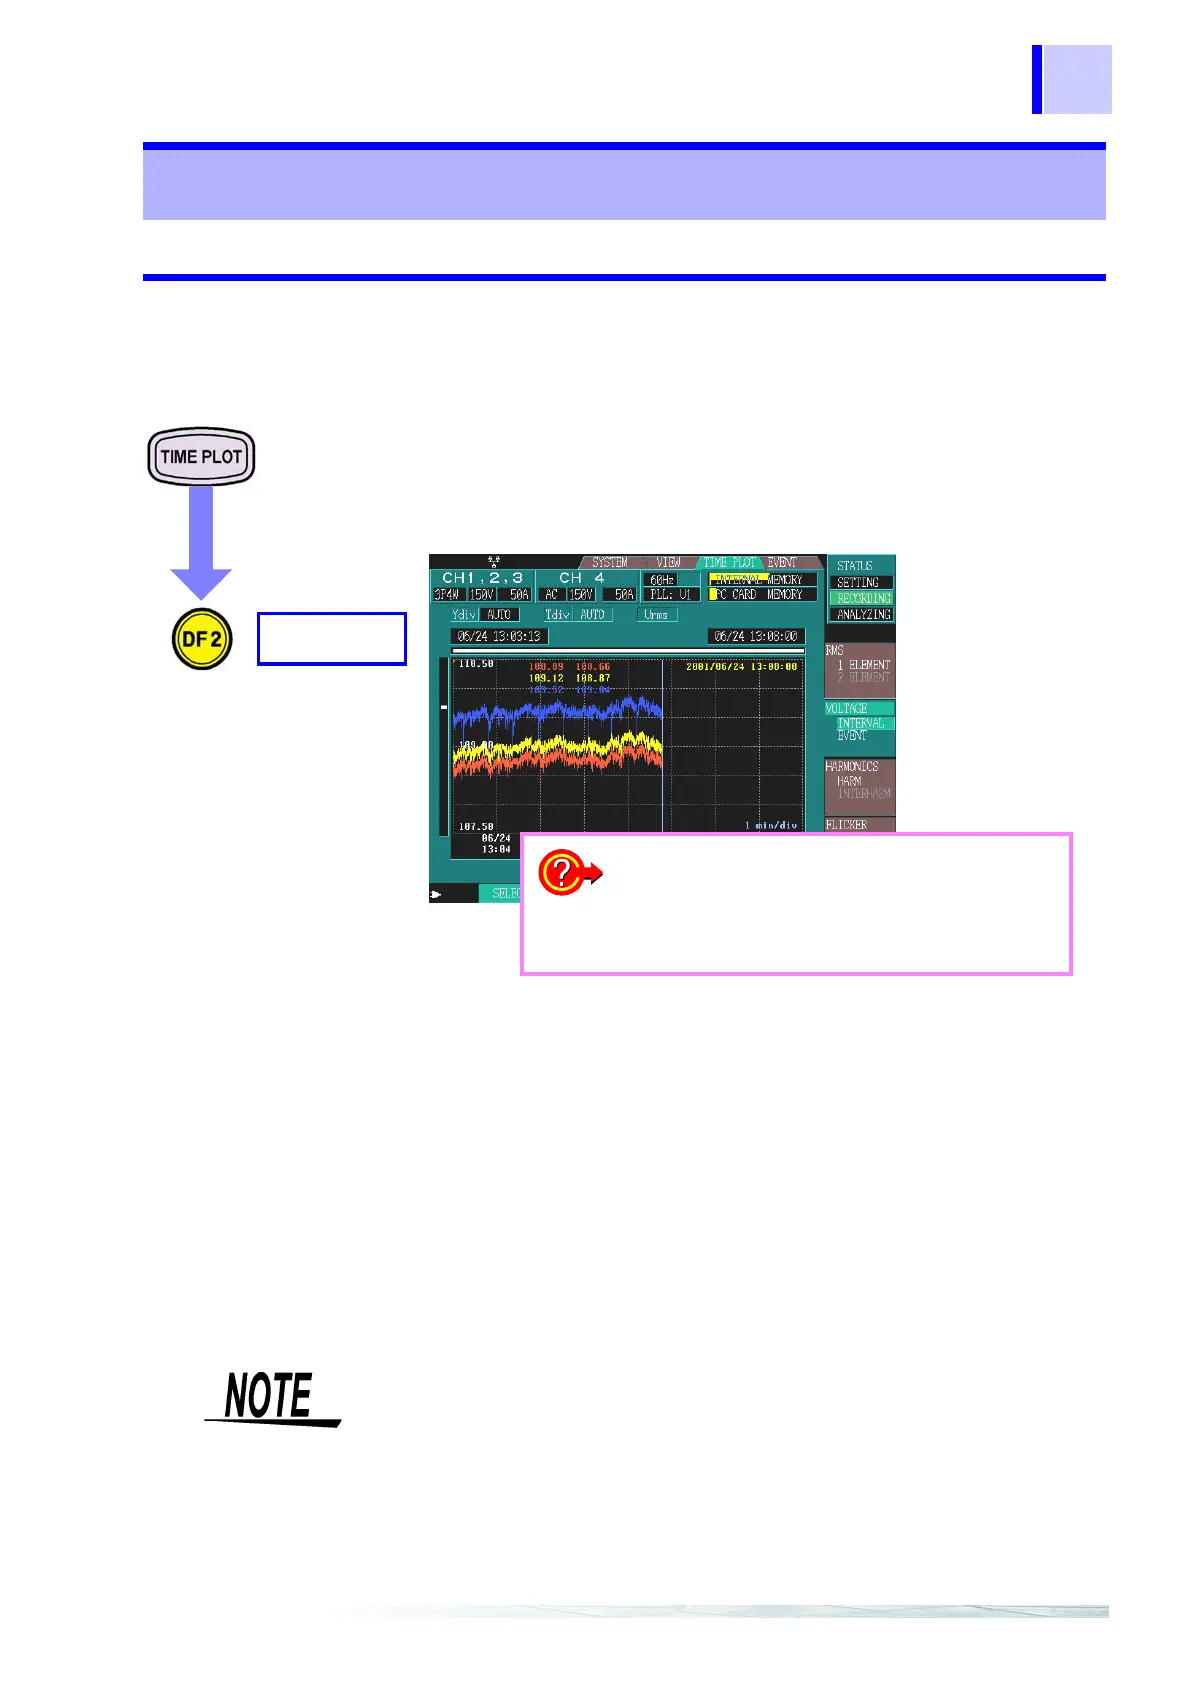
INTERVAL
VOLTAGE
Example: 3P4W (three-phase four-wire)
Displays a time series
graph for U1, U2, and
U3.
Modified values are
displayed as MAX and
MIN values.
Red: U1
Yellow: U2
Blue: U3
❖ Changing the Y-axis scale (page 94)
❖ Changing the X-axis scale (page 94)
❖ Cursor measurements (page 94)
❖ Scrolling through waveforms (page 95)
❖ Searching for events (page 95)
When you select MAX/MIN/AVE or AVE in the data type settings as
recorded data ([SYSTEM]-DF2[RECORDING]), the MAX and MIN
values are displayed in a time series graph.
Note that the MAX and MIN values are displayed in a single graph for
changes in voltage instead of the MAX, MIN, and AVE values dis-
played in three graphs as for changes in RMS value.