6.4 Changes in Voltage
96
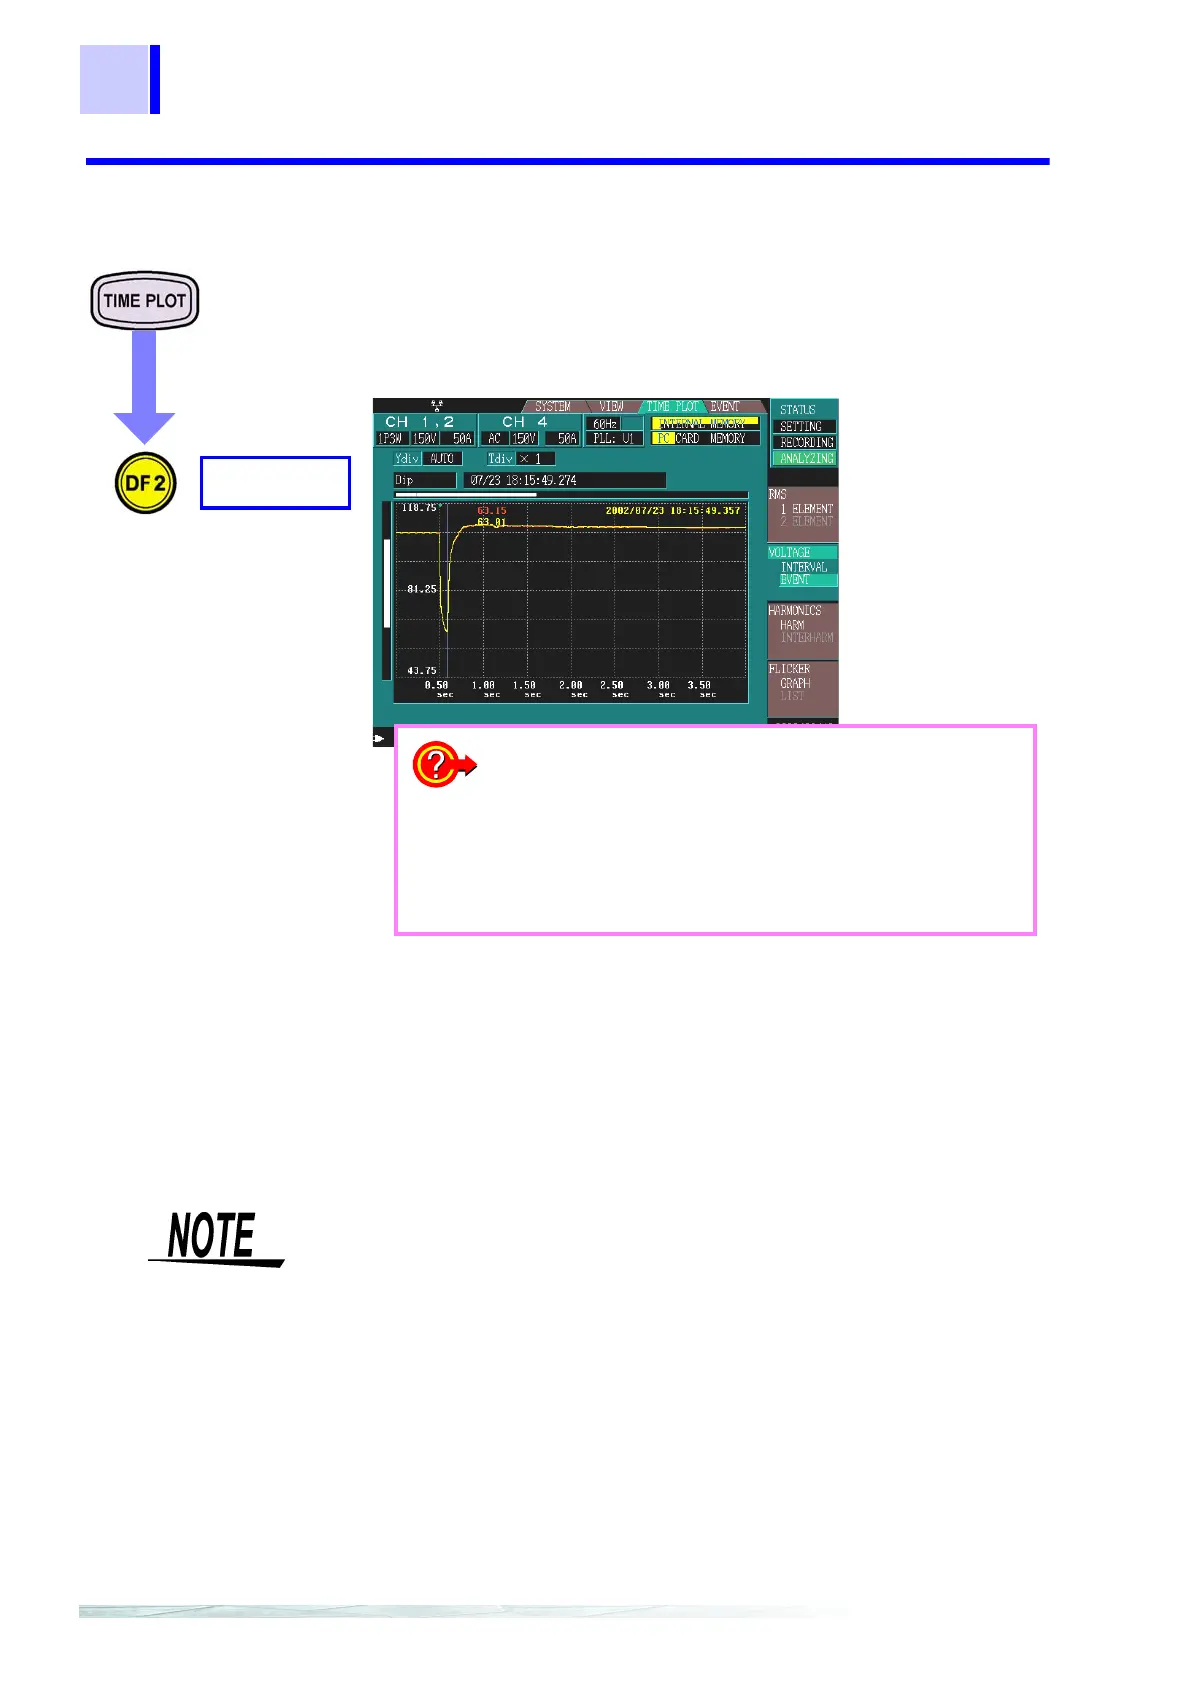
6.4.2 Graphing Voltage Fluctuations for Events
When an event occurs, the voltage calculated by the 3196 for a single
waveform shifted half a wave can be displayed in a time series graph
spanning 10 seconds.
The only events that are valid for recording are voltage swells, voltage
dips, and voltage interruptions.
Only one voltage fluctuation event graph is recorded in internal mem-
ory.
By using a PC card, your can record and display multiple voltage fluc-
tuation event graphs.
EVENT
VOLTAGE
Example: 1P2W (single-phase two-wire)
Displays a time series
graph for U1, U2, and
U3.
Pre-trigger is fixed to
0.5 second and over-
all recording length to
10 seconds.
Red: U1
Yellow: U2
Blue: U3
❖ Changing the Y-axis scale (page 97)
❖ Changing the X-axis scale (page 97)
❖ Cursor measurements (page 97)
❖ Scrolling through waveforms (page 98)
❖ Displaying voltage fluctuation event graphs stored
on a PC card (page 98)
❖ Automatically recording multiple voltage fluctuation
event graphs on a PC card (page 99)
• Recording is possible regardless of the recording data type settings and
interval setting (SYSTEM-DF2[
RECORDING]).
• When measuring at 400 Hz, maximum and minimum values are calcu-
lated from every eight data values at each cycle.