6.4 Changes in Voltage
98
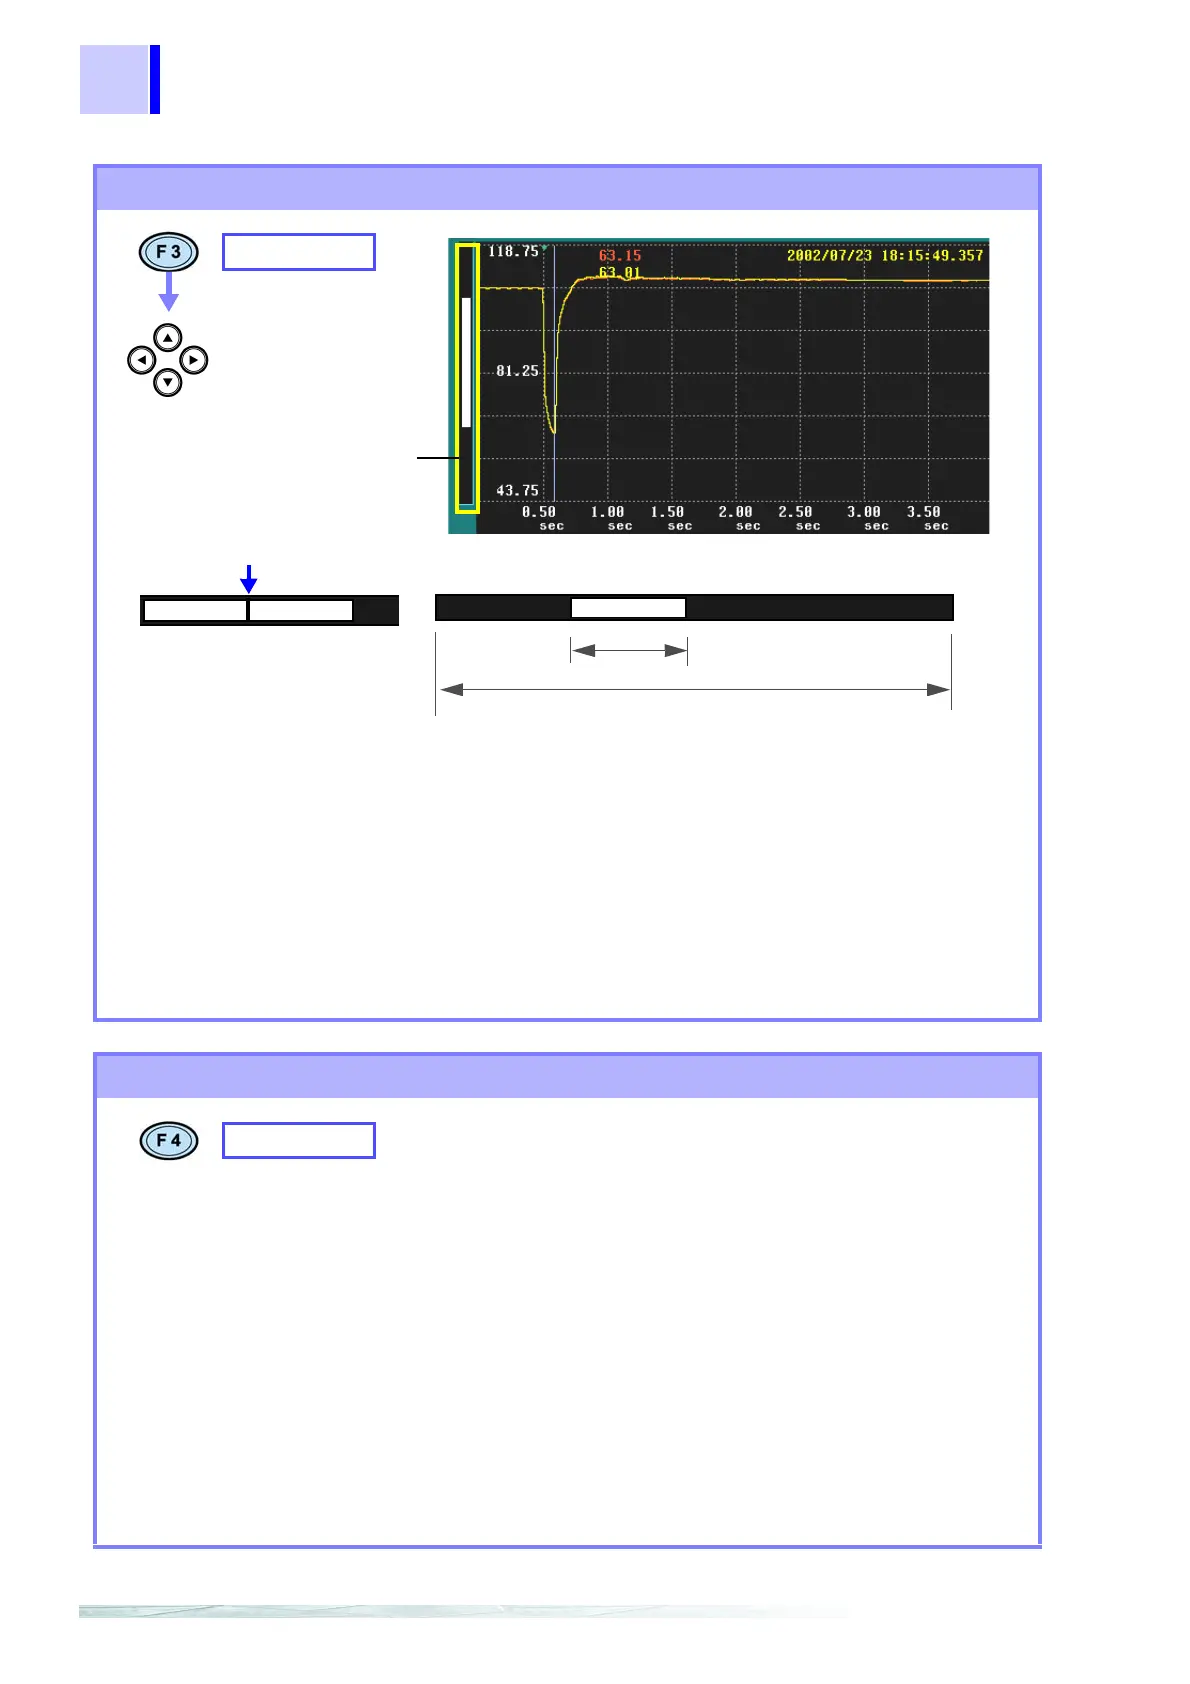
Scrolling through waveforms
SCROLL
Scroll through the
graph
Scroll bar
Graph display range
All recorded data
The graph display range (white belt) on the scroll bar ind
cates what interval of recorded data is displayed on th
screen.
When AUTO is set during recording, the X-axis and Y-axis ar
automatically scaled so that all the time series graphs are dis
played on the screen.
If you change the X/Y-axis scale, you can scroll through th
time series graph in every direction.
Waveform display
range
Cursor position
The cursor on the scroll bar
indicates where the cursor is
positioned on the all recorded
data.
Displaying voltage fluctuation event graphs stored on a PC card
NEXT FILE
You can read and display voltage fluctuation event graphs
recorded on a PC card.
Each depression of this key reads the next in a series of volt-
age fluctuation event graph on the PC card.
This operation is only possible in the following circumstances.
• When a PC card is inserted during analysis
• When voltage fluctuation event data is recorded on the PC
card in binary format
It is also possible to analyze data stored on the PC card after
loading all binary measurement files into the analyzer. (How-
ever, the PC card must be left in the analyzer during operation
as data is read at each stage.)