6.3 Changes in RMS Value
89
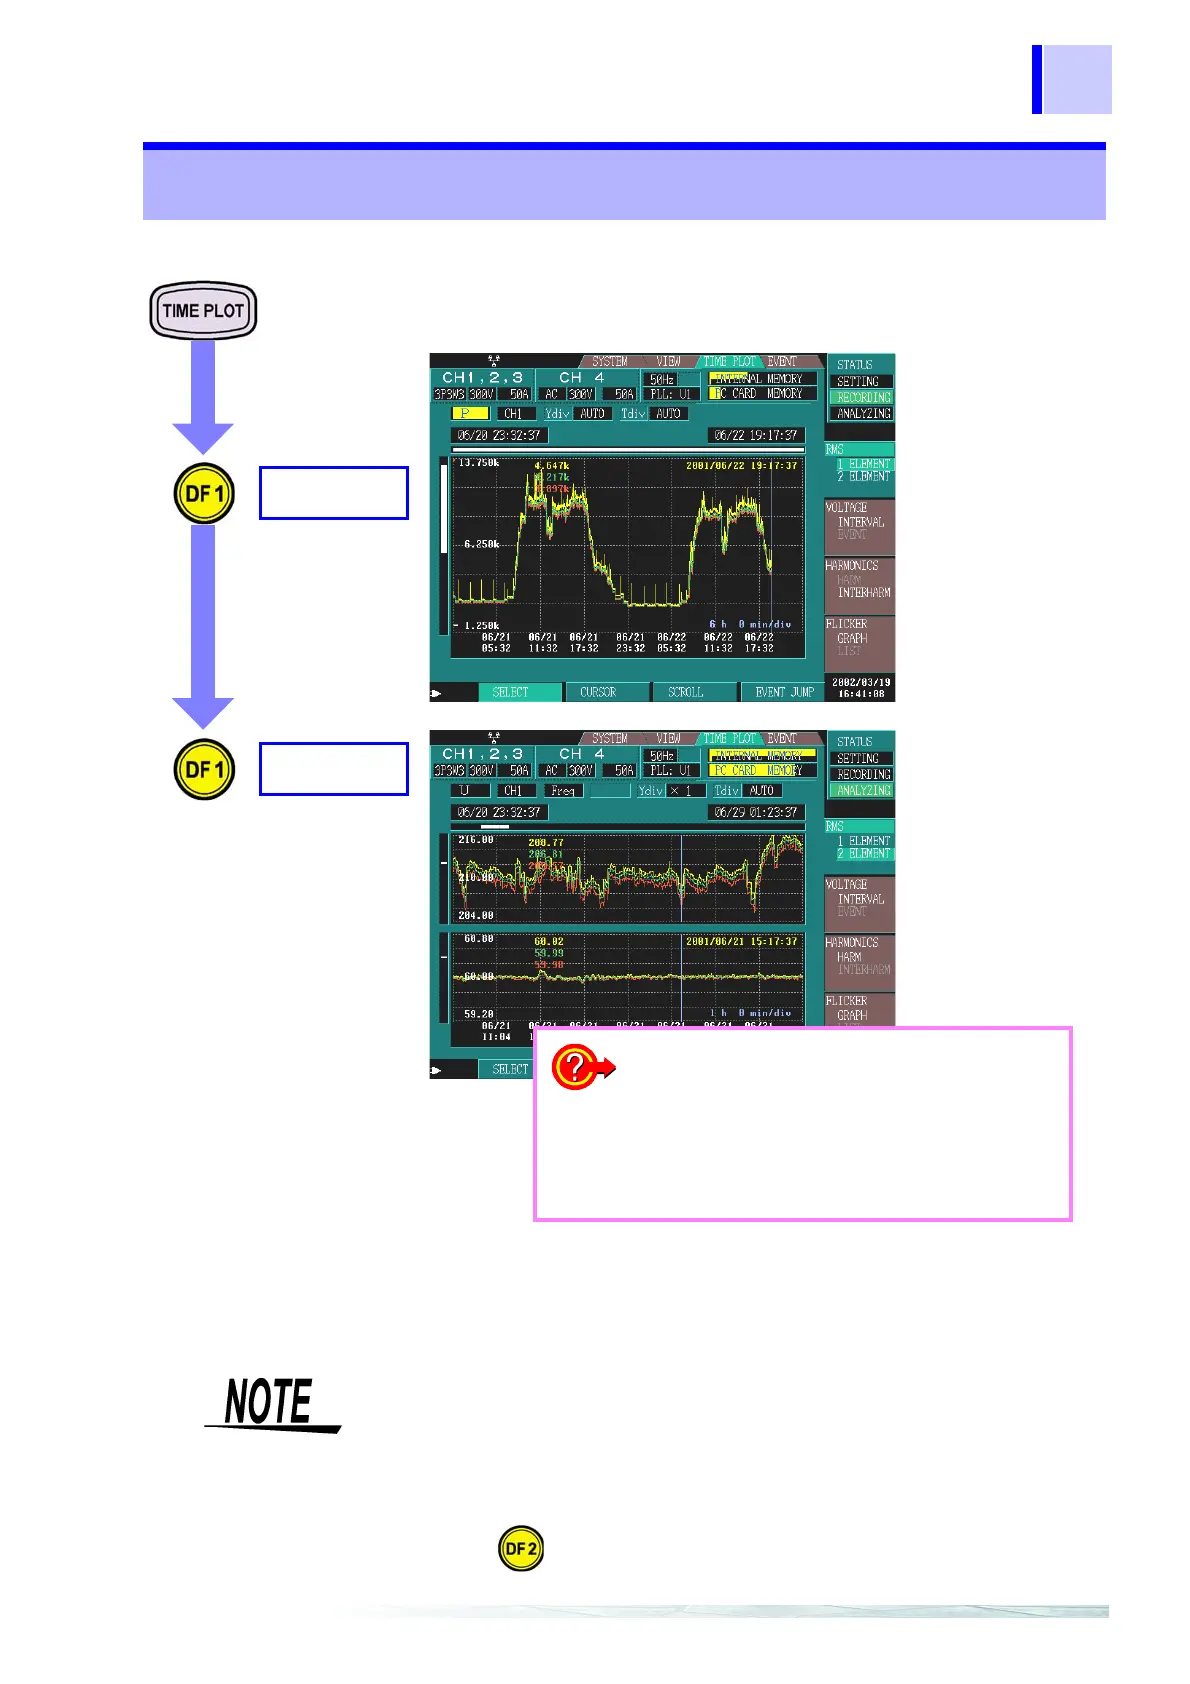
Display items calculated by the 3196 at 200 ms intervals can be dis-
played in a time series for each interval.
6.3 Changes in RMS Value
2 ELEMENT
RMS
1 ELEMENT
3P4W (three-phase four-wire)
You can select a sin
gle item from the dis
play items to be
displayed in the time
series graph.
Yellow: MAX value
Green: AVE value
Red: MIN value
You can select two
items from the dis-
play items to be dis-
played in the time
series graph.
Yellow: MAX value
Green: AVE value
Red: MIN value
❖ Changing the display item (page 90)
❖ Changing the display channel (page 90)
❖ Changing the Y-axis scale (page 91)
❖ Changing the X-axis scale (page 91)
❖ Cursor measurements (page 91)
❖ Scrolling through waveforms (page 92)
❖ Searching for events (page 92)
MAX, MIN, and AVE indicate the maximum, minimum, and aver-
age during the interval.
• When you select AVE in the data type settings as the recorded data
([SYSTEM]-DF2[
RECORDING], a time series graph is displayed for the
AVE value only instead of three types of time series graphs being dis-
played for the MAX, AVE, and MIN values as above.
• When using the time series graph to observe swells, dips, and interrup-
tions,
and to record Δ U deviation with respect to the nominal voltage,
use VOLTAGE.