6.5 Changes in Harmonics
100
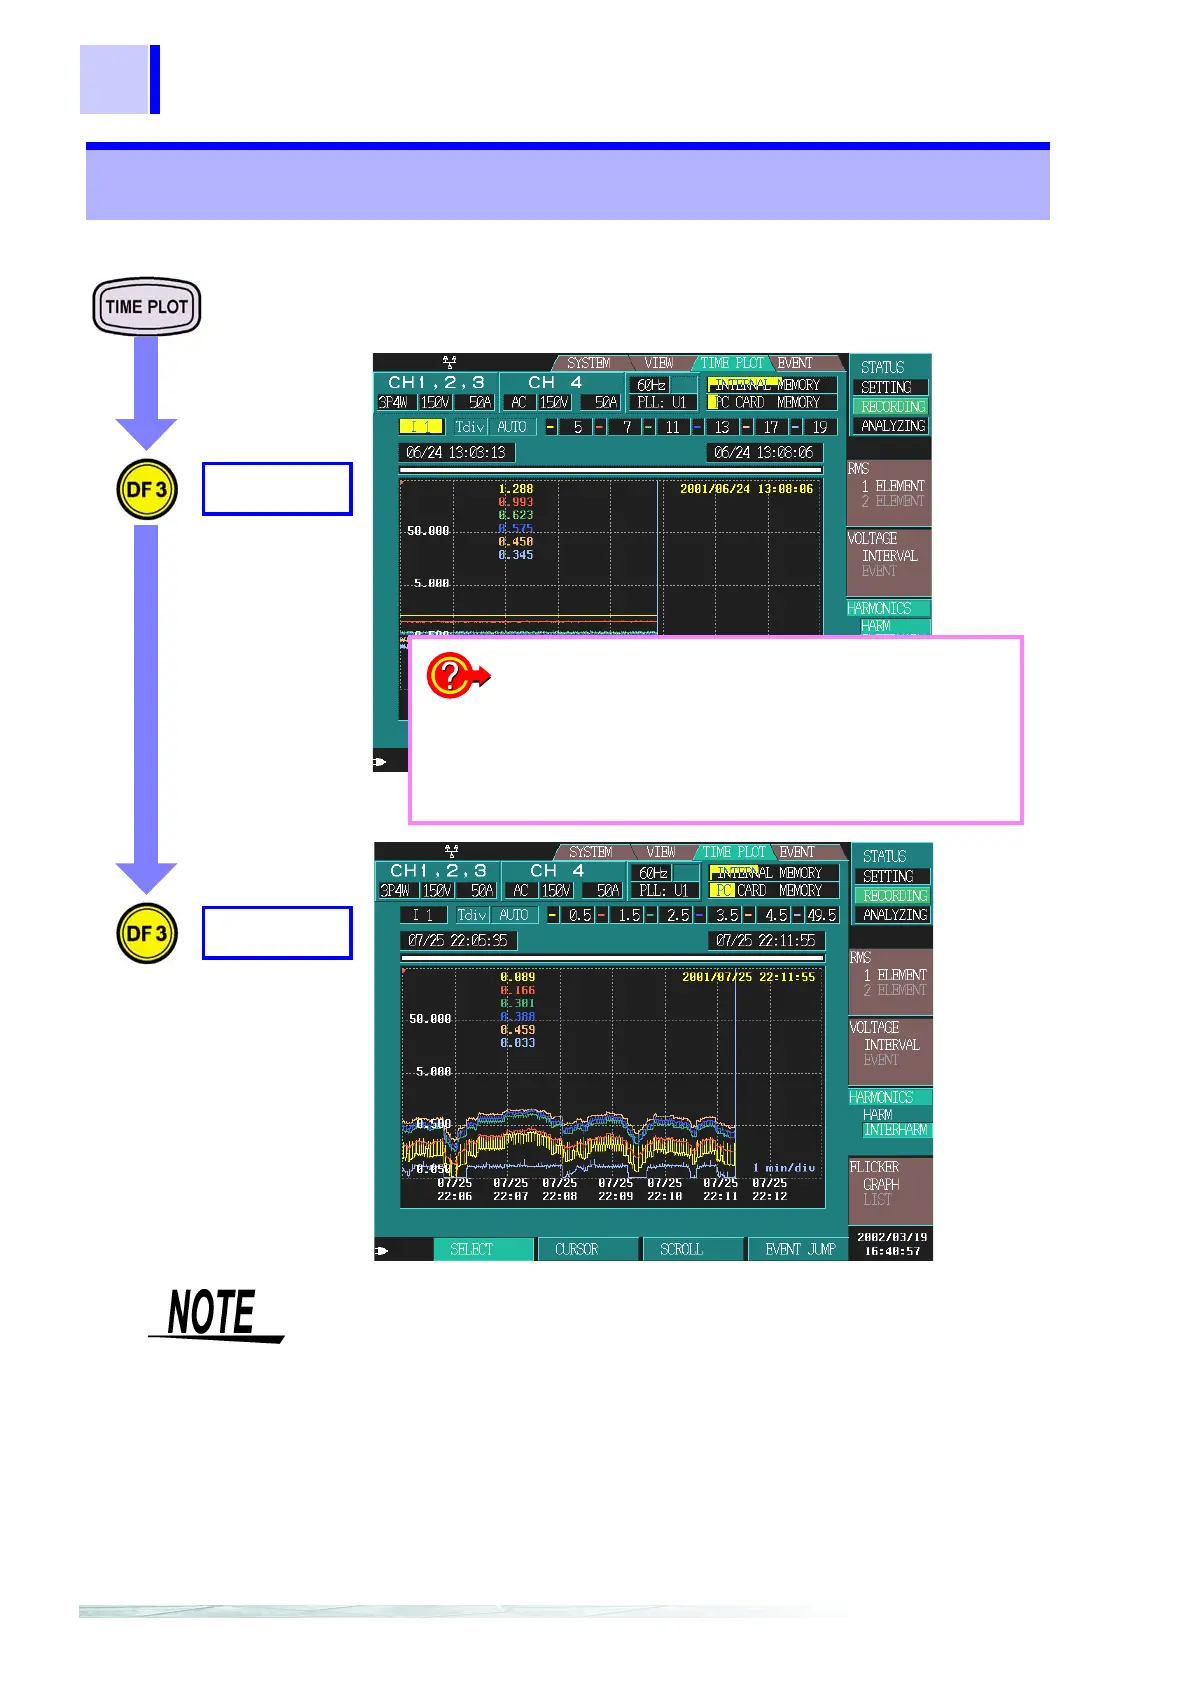
You can select six orders and display them in a harmonics time series
graph.
6.5 Changes in Harmonics
HARM
INTERHARM
HARMONICS
3P4W (three-phase four-wire)
❖ Changing the display item (page 101)
❖ Changing the X-axis scale (page 101)
❖ Changing the order number displayed (page
102)
❖ Cursor measurements (page 102)
❖ Scrolling through waveforms (page 103)
❖ Searching for events (page 103)
• When Power is selected in the recorded item settings (SYSTEM-
DF2[
RECORDING]) as recorded data, you cannot display the harmon-
ics time series graph. Also, when
Power or P&Harm is selected, you
cannot display the changes in harmonics time series graph for inter-har-
monics.
• When you select
MAX/MIN/AVE in the data type settings (SYSTEM-
DF2[
RECORDING]) as recorded data, the MAX and MIN values are dis-
played in a single graph.
• When the 400 Hz measurement frequency is selected, harmonic analysis
is performed up to the 10th order, and inter-harmonic analysis is not
available.