6.5 Changes in Harmonics
103
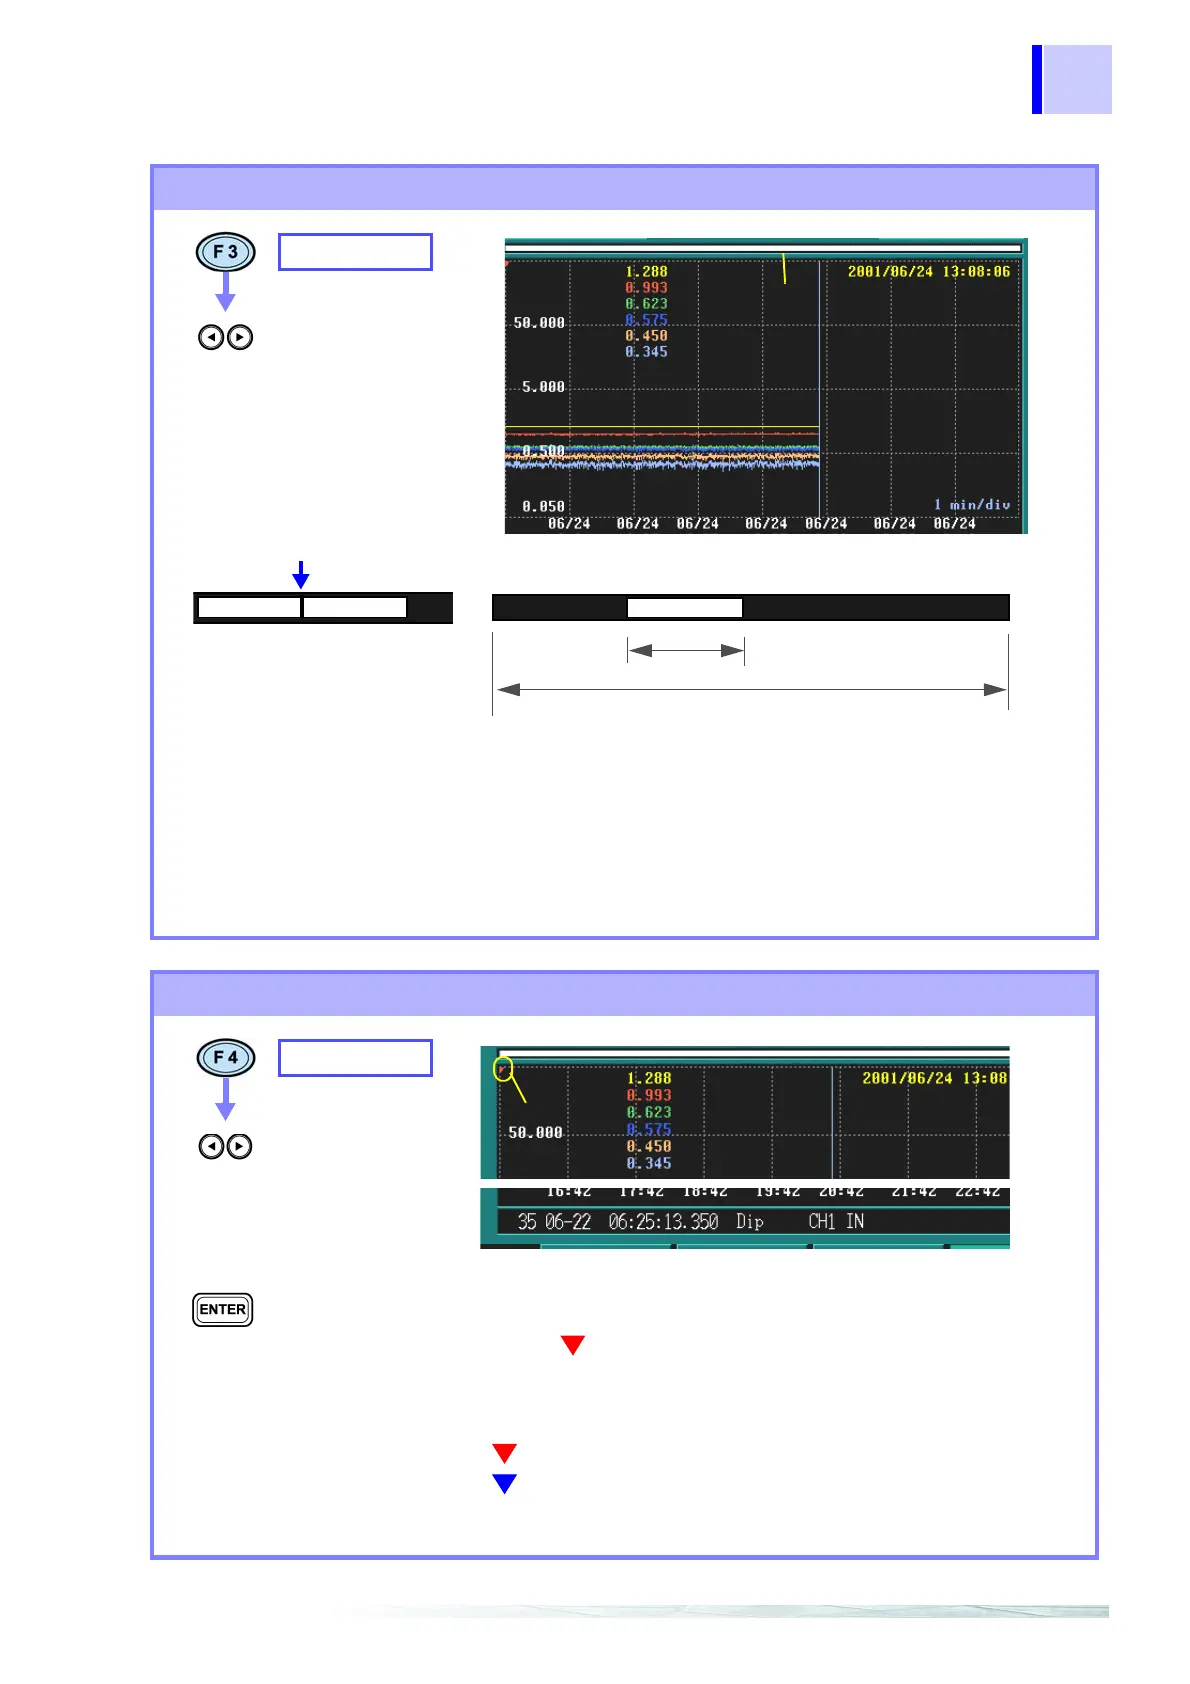
Scrolling through waveforms
SCROLL
Scroll through the
graph
Scroll bar
Graph display range
All recorded data
The graph display range (white belt) on the scroll bar ind
cates what interval of recorded data is displayed on th
screen.
During measurement, the Y-axis is automatically scaled s
that all the time series graphs are displayed on the screen.
When measurement stops, if you change the X-axis scale
you can scroll the time series graph right and left.
Scroll bar
Cursor position
The cursor on the scroll bar
indicates where the cursor is
positioned on the all recorded
data.
Searching for events
Event marker
EVENT JUMP
Skips sideways
through the event
markers.
Analyzing events using
waveforms
Synchronization is achieved with an event selected from th
event list.
You can search for the time the event occurred (even
marker ).
The start time and stop time event markers are always dis
played.
Event marker
(red): Indicates an ordinary event.
(blue): Indicates an event for which an event voltag
fluctuation graph is recorded.