6.3 Changes in RMS Value
92
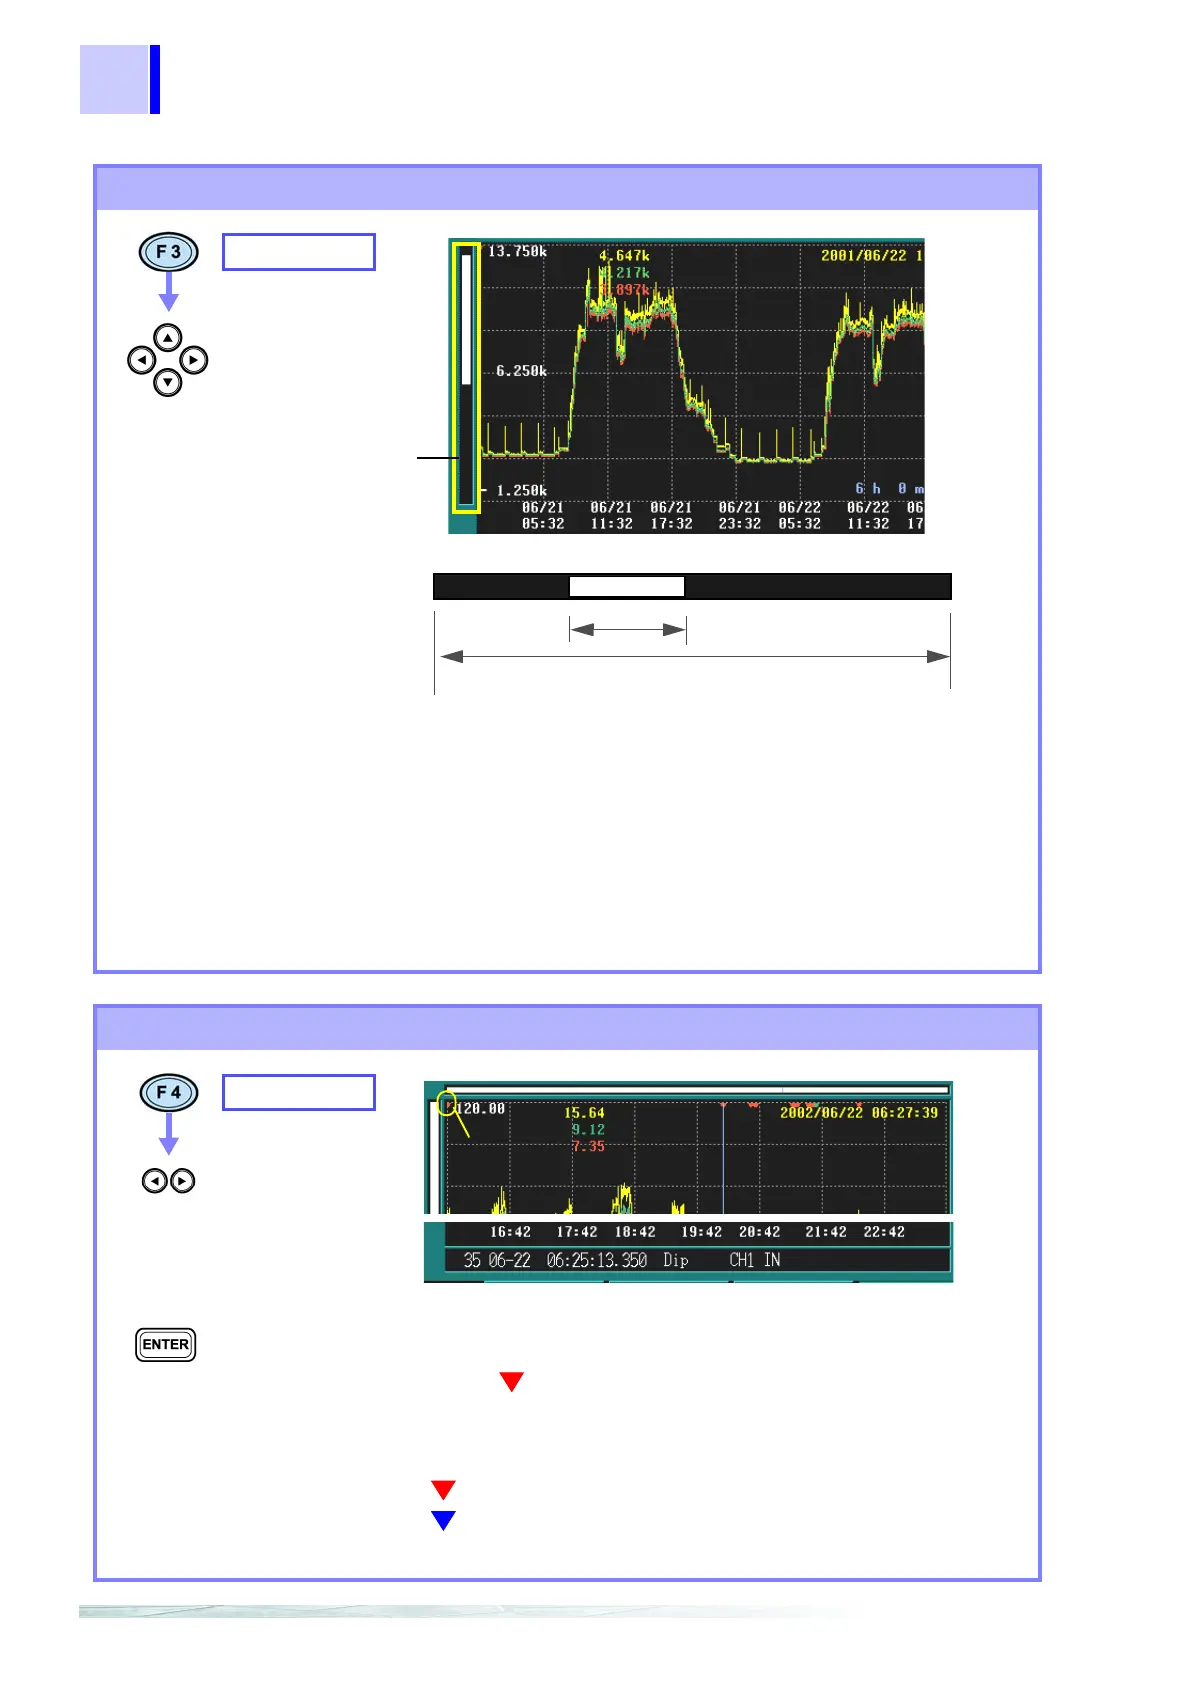
Scrolling through waveforms
SCROLL
Scroll through the
graph
Scroll bar
Graph display
All recorded data
The waveform display range (white belt) on the scroll ba
indicates what interval of recorded data is displayed on the
screen.
When AUTO is set during recording, the X-axis and Y-axi
are automatically scaled so that all the time series graphs are
displayed on the screen.
When measurement stops, if you change the X-axis scale
you can scroll through the time series graph in every direc
tion.
Waveform display
range
Searching for events
Event marker
EVENT JUMP
Synchronization is achieved with an event selected from the
event list.
You can search for the time the event occurred (even
marker ).
The start time and stop time event markers are always dis
played.
Event marker
(red): Indicates an ordinary event.
(blue): Indicates an event for which an event voltage
fluctuation graph is recorded.
Skips sideways
through the event
markers.
Analyzing events using
waveforms