6.3 Changes in RMS Value
91
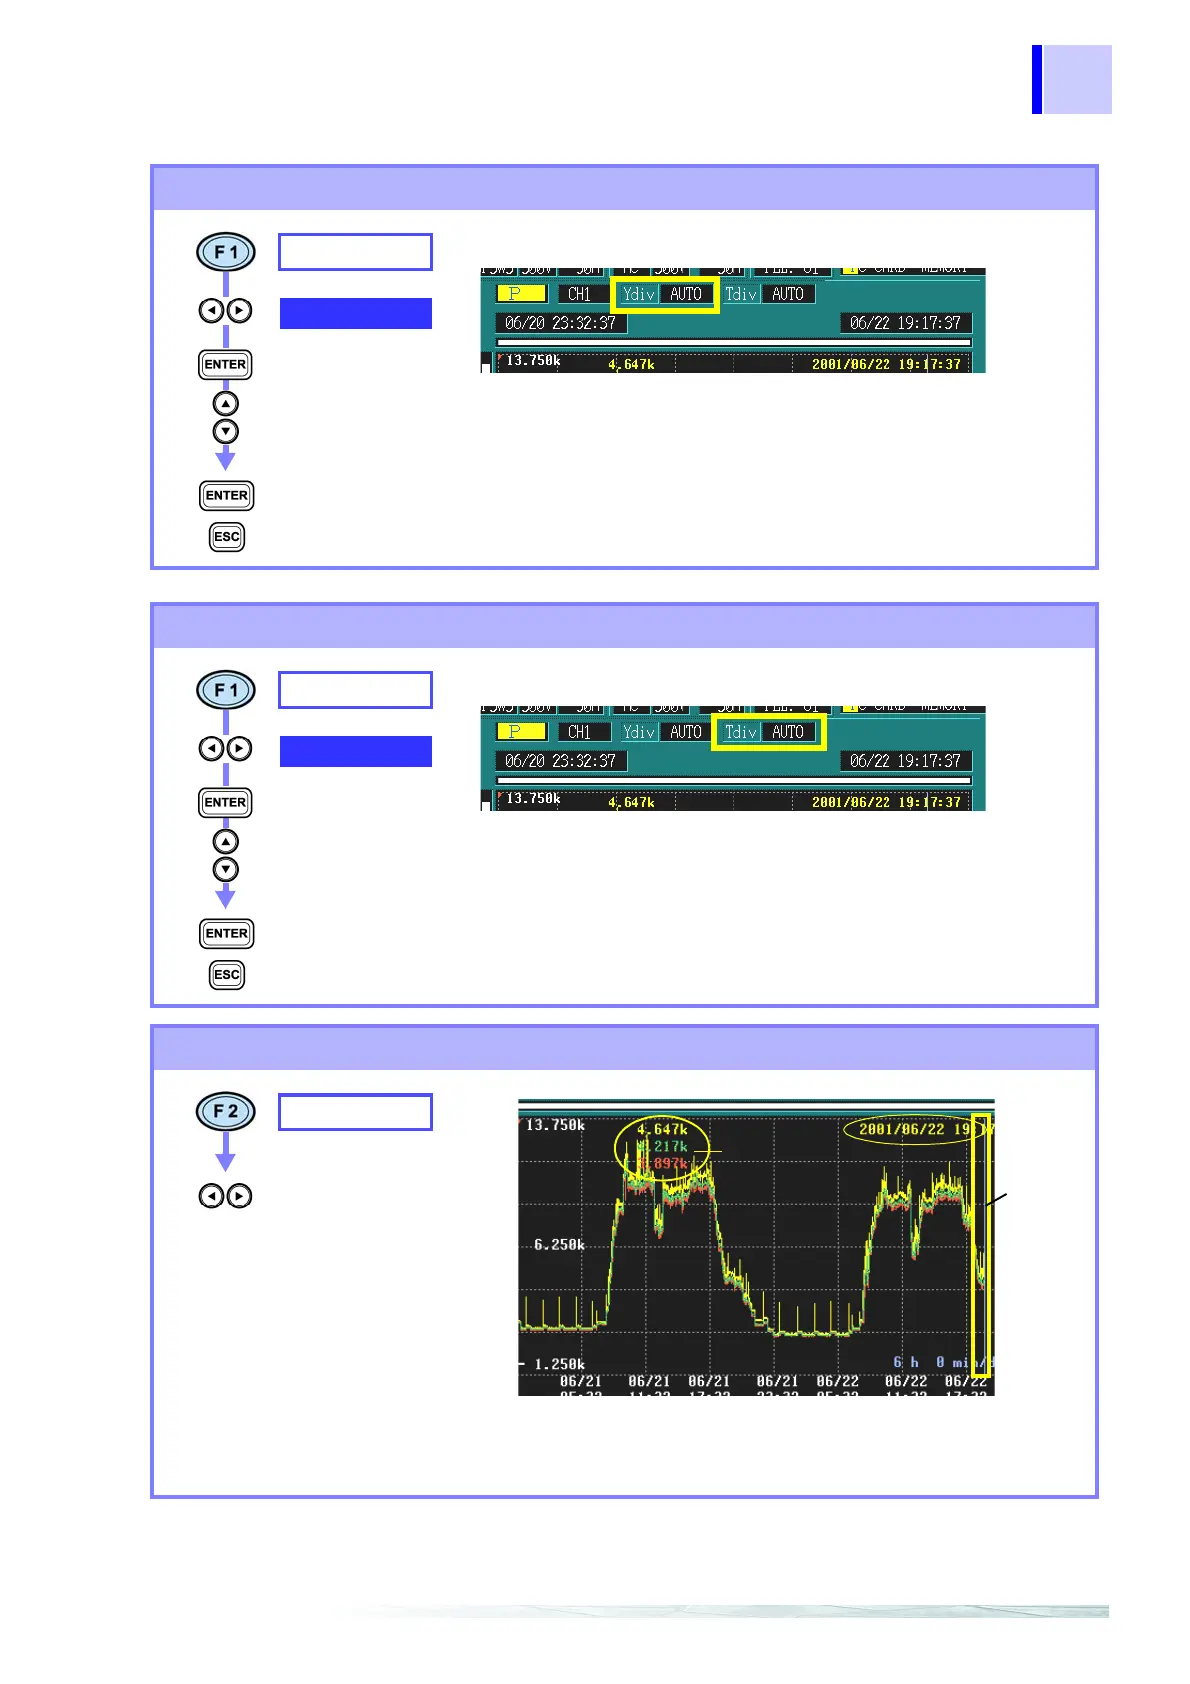
Changing the Y-axis scale
SELECT
Ydiv
Select from pull-
down menu
Confirm
Cancel
AUTO, x1, x2, x5, x10, x25, x50
When you want to reduce the graph, make the scale smaller.
When you want to enlarge the graph, make the scale larger.
When recording, use AUTO.
Changing the X-axis scale
Cursor measurements
SELECT
Tdiv
Select from pull-
down menu
Confirm
Cancel
AUTO, x1, x1/2, x1/4, x1/8, x1/16, x1/32, x1/64
When you want to reduce the graph, make the scale smaller.
When you want to enlarge the graph, make the scale larger.
When recording, use AUTO.
Cursor value
CURSOR
Move the vertical cursor
left and right to read the
display value.
You can read the value above the cursor and the time on th
time series graph.
(MAX/MIN/AVE display)
Yellow: MAX value
Green: AVE value
Red: MIN value
(AVE display)
Yellow: AVE value
Cursor
Cursor
time