139
_____________________________________________________________________________________________
5.5 Value Comparison Details
______________________________________________________________________________________________
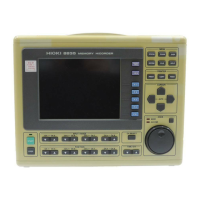
5.5.6 Display of value calculation results
The left diagram shows an example of a FAIL for value
calculation No. 3.
The value calculation result No. 3 is indicated as
"*******."
The value comparison result No. 3 is "FAIL."
The overall comparison result at the upper-left corner of
the screen will be "FAIL."
The overall comparison result will be "PASS" when all
comparison results are "PASS." If even one "FAIL"
comparison result is obtained, the overall comparison
result will be "FAIL."
If two values, the maximum value and minimum value,
are calculated (e.g., for frequency), the results will be
displayed as "minimum value - maximum value," as
shown on the left.
・Value calculations are executed automatically on the acquisition of a
waveform of set recording length.
Value calculations can also be performed for waveforms already acquired
or transferred from a PC card. (See 5.2.8)
・If a value comparison is set, a comparison is made to determine if the
value of the calculation result falls within the range
defined by the upper and lower limits.
・The value calculation result is displayed at the bottom of the screen, as
shown below.
If the calculation cannot be executed properly, "*******" is indicated. In
such cases, the comparison result will be "FAIL."
・The value comparison result can be displayed on the left side of the
screen. (See 4.2.7)
 Loading...