Affinity
2.0
Additional Information Page 261
Measurement time (in seconds): Duration for the measurement can be set using the slider. This
is only relevant for broad band signals. A number of seconds can freely be selected between 1
and 1200. By default the measurement time is the same for all signals.
Instructions: This allows for adding picture instructions. If the box is ticked an instruction box
explaining how to perform the measurement will appear upon pressing START.
4) Display:
Display Peaks and Valleys: This is relevant when using a broad band signal. When ticking the
check box the REM440 will show the measured maximum and minimum area in the speech
spectrum over time (5 seconds) on screen. The measurement is independent of the selected
measurement time.
1/3 octave and overlapping time window: For speech-like signals, the signal is converted into an
FFT and then sampled. The clock frequency of the Affinity is 44100 Hz and we do 1024
samples per second. This means that the time period for each sample is 23 ms.
Percentiles for full measurement: activate this box if you want to see the intensity components
in different shaded percentile sections – these are customisable and will show the output as a
shaded range on the graph.
Show dynamic compression ratio: Enabling this feature will display the dynamic compression
ratios when the 1/3 octave and overlapping time windows option is enabled.
Set settings to IEC 60118-15: use this button in order to set the measurement settings
according to the IEC 60118-15 standard
45
this will amend the settings mentioned above to meet
this configuration description.
Show target: This will add the fitting target from the screen or REM440 setup (see section 2.6.4)
by default.
Show SII: This will add the Speech Intelligibility Index to the graph (see section 0)
Show MPO: This will remove the MPO when using the DSL mi/o fitting prescription in Response
view.
Percentile analysis: Here percentiles can be selected for the percentile analysis (see section 0
).
The recommended percentiles are 30
th
, 65
th
and 99
th
. When Display peaks and valleys is ticked
it is NOT possible to set percentiles under Percentile analysis.
5) Recording Method:
Resolution (of frequency): Select the preferred resolution in the dropdown. The higher the
resolution the slower the measurement.
Keep in mind that 1/3 is what is used in many hearing aid manufacturers software. If the curve
is to be compared to this you may consider choosing this resolution. Also note that when using
a broad band signal the dropdown list will be greyed out and automatically choose FFT. This
makes the distance between frequency bins 43 Hz which ensures precision in the
measurement.
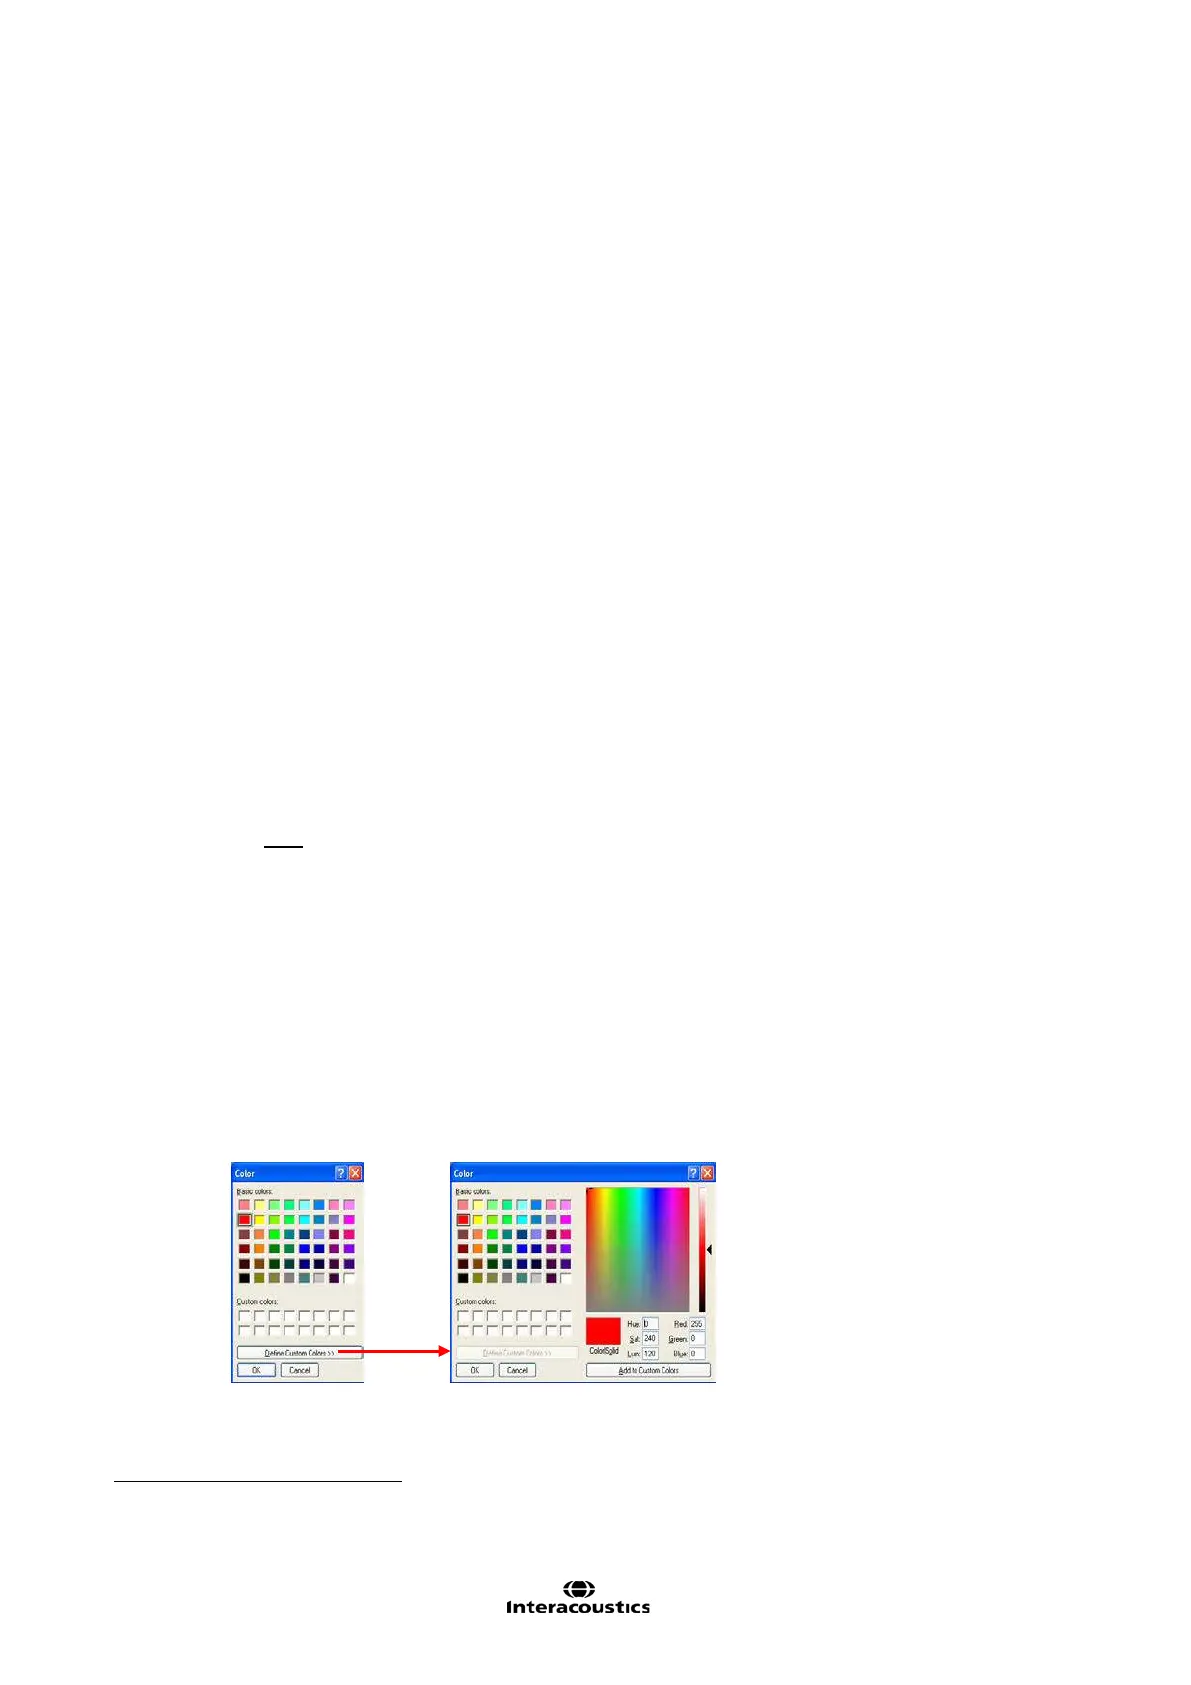
6) Colour:
Select a colour for the Right and Left curve.
Press each of the buttons to have the custom colour selection below. Choose the desired colour
by clicking on it and press OK.
Note the option to Define Custom Colours and get a more extensive selection. When having found
the exact colour, press Add to Custom Colours.
45
For detailed information, please refer to the IEC 60118-15 standard.