Affinity
2.0
Additional Information Page 271
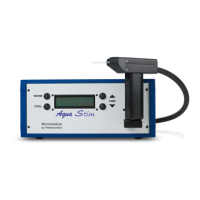
Examples:
Note: Numerically reported MAX OSPL90 Level is determined from a non-smoothed curve, and as such not
affected by smoothing level, even though the smoothed waveform may appear to have a reduced peak
around the MAX SPL area.
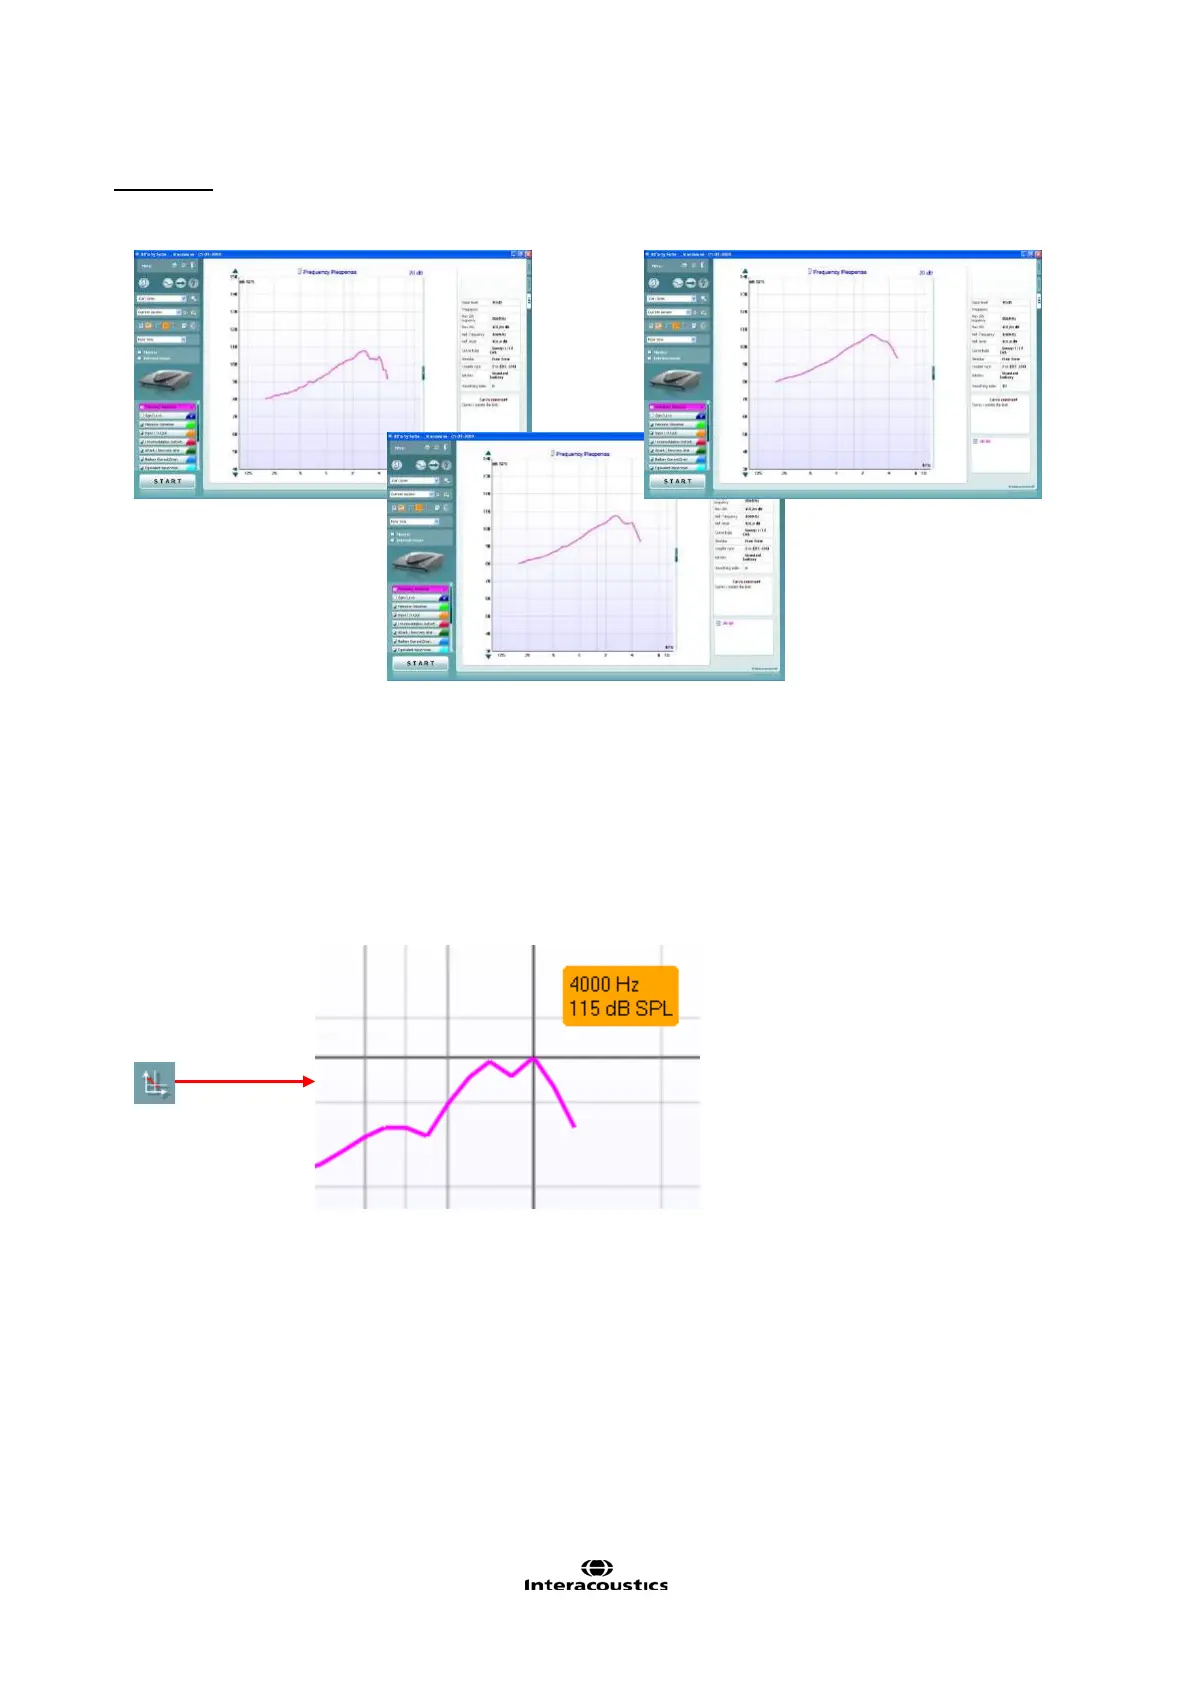
3.6.8 Show Cursor on the Graph
When comparing the graph in the fitting software/specification sheet to the graph in the HIT440 the Show
cursor on graph may be useful. Upon selecting the function the cursor will “glue” to the highlighted curve
showing the exact measured value at each frequency.
Note: As the cursor tracks the displayed curve, any smoothing applied to the curve will influence the reading.
This may have the effect that a smoothed curve will report one max OSPL90 level with the cursor and a
different max OSPL90 level in the numerical data section. Unsmoothing will make the two readings identical.
3.6.8.1 Managing Multiple Curves
If measuring many curves during the same test session there are several ways to provide a more simple
view (or a comparison view) showing only the preferred curves in the same graph.