Affinity
2.0
Additional Information Page 13
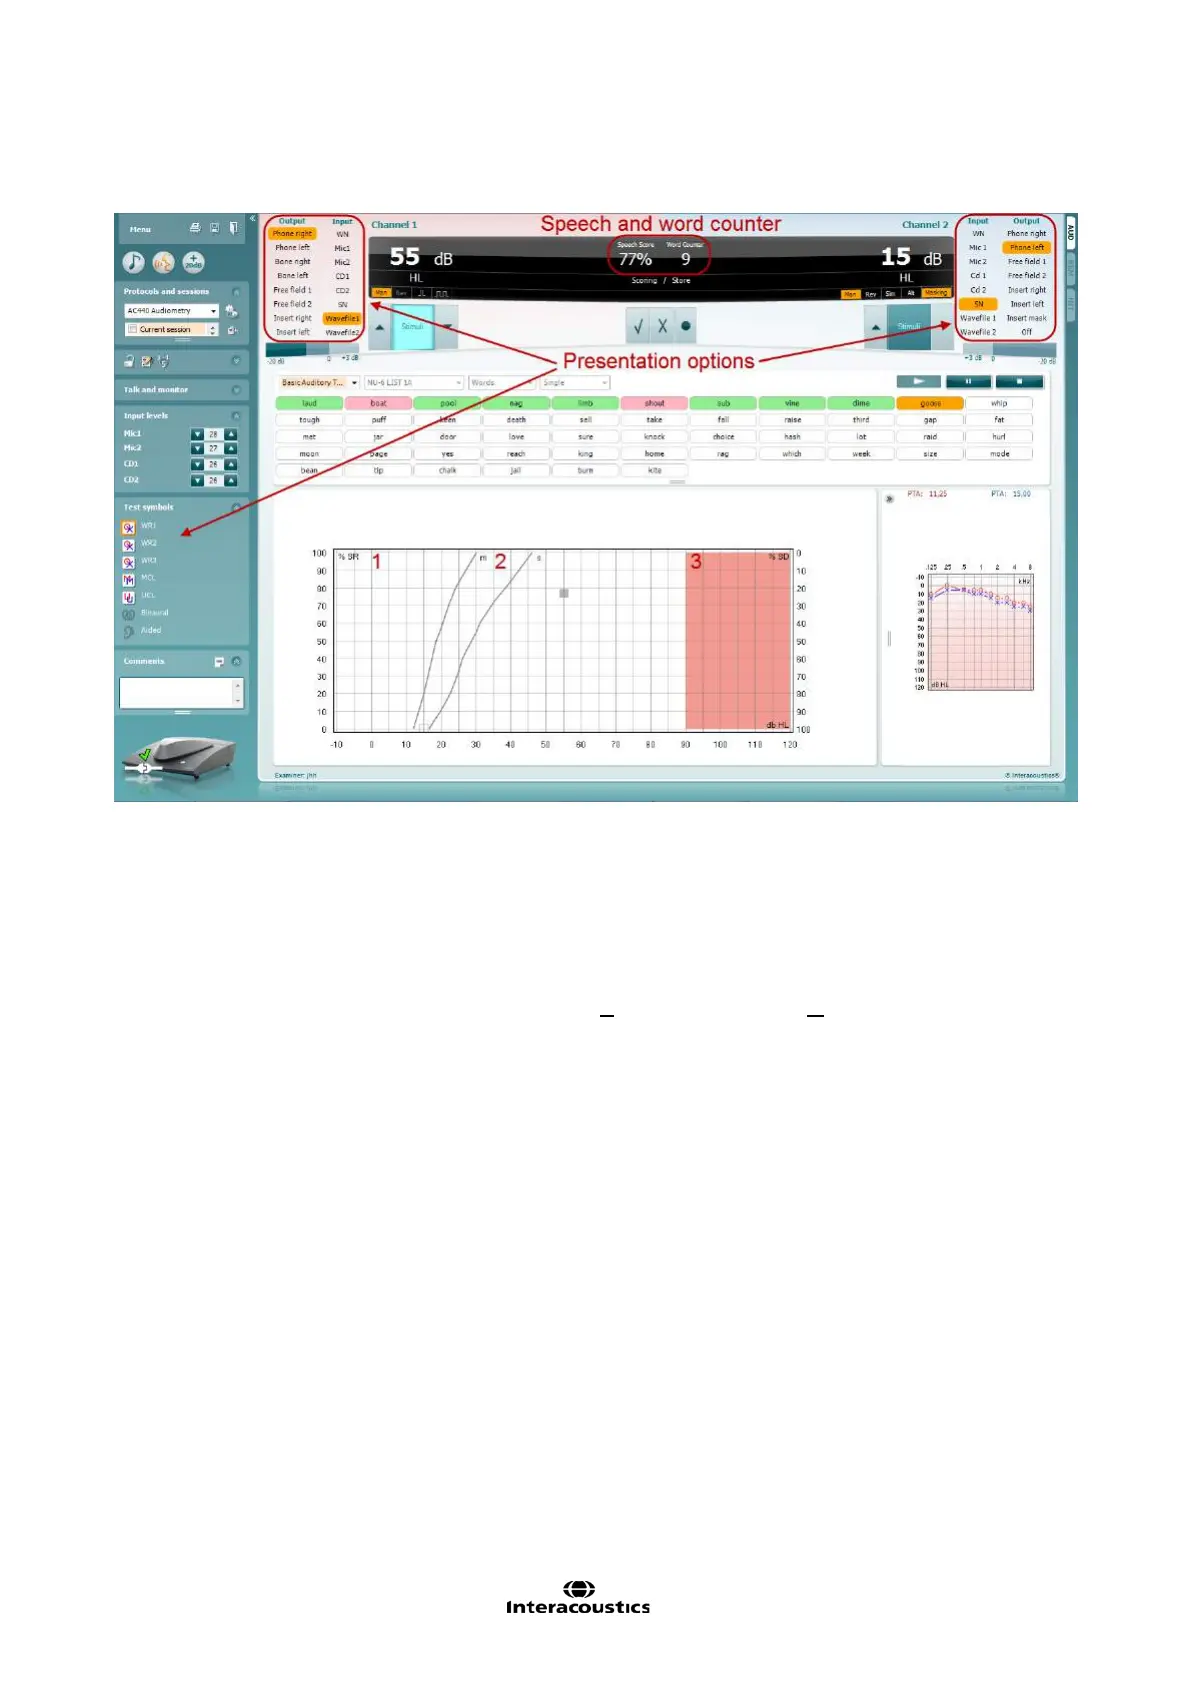
1.3.1 Speech Audiometry in Graph Mode
Graph mode presentation settings in the lower left corner and in the presentation options (Ch1 and Ch2) in
the upper part of the screen you can adjust the test parameters during the test.
1) The graph: The curves of the recorded speech graph will be displayed on your screen.
The x-axis shows the intensity of the speech signal and the y-axis shows the percentage score.
The score is also displayed in the black display in the upper part of the screen along with a word
counter.
2) The norm curves illustrate norm values for S (Single syllabic) and M (Multi syllabic) speech material
respectively. The curves can be edited according to the normative data you wish to use in the AC440
setup (see section
1.7.2.3)
3) The shaded area illustrates how high in intensity the system will allow. The Extended Range +20 dB
button can be pressed to go higher. The maximal loudness is determined by the transducer
calibration.