Affinity
2.0
Additional Information Page 170
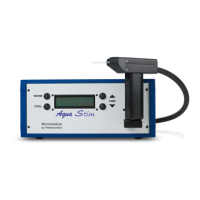
2.6.8.2 Table Mode
If graph comparisons are not preferred, you can choose the Table mode button
. This may make it
easier to compare the measured numerical values and the values in the hearing aid manufacturer’s fitting
software.
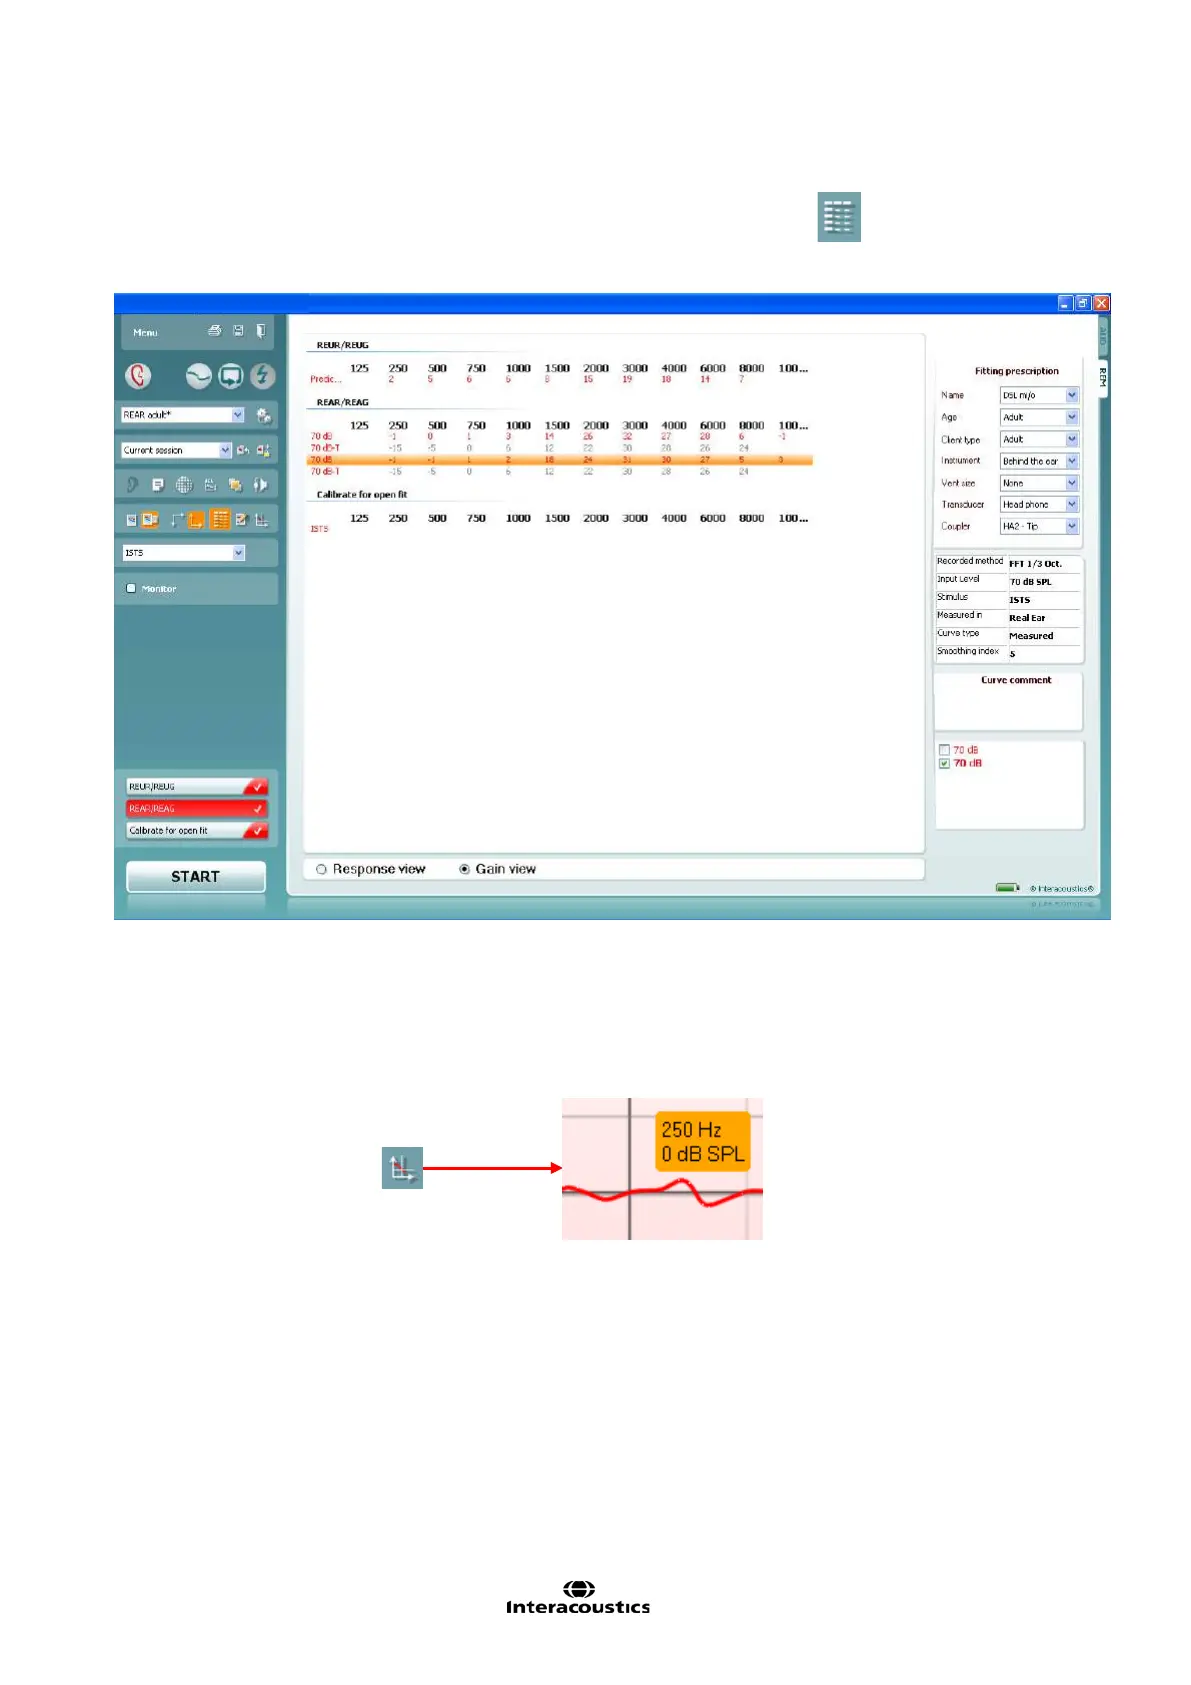
2.6.8.3 Show Cursor on the Graph
When comparing the graph in the fitting software to the graph in the REM440 the Show Cursor on Graph
may be useful. Upon selecting the function the cursor will highlight the curve and allow you to see the exact
measured value at each frequency.