Affinity
2.0
Additional Information Page 257
2.12.2 Display Peaks and Valleys
Display peaks and valleys can be added in the REM440 setup (see section 0)
When Display peaks and valleys is ticked you will have the view illustrated below. The peaks and valleys are
shaped according to the LTASS and are the same as the 30
th
and 99
th
percentile in the Percentile Analysis
described in section 0.
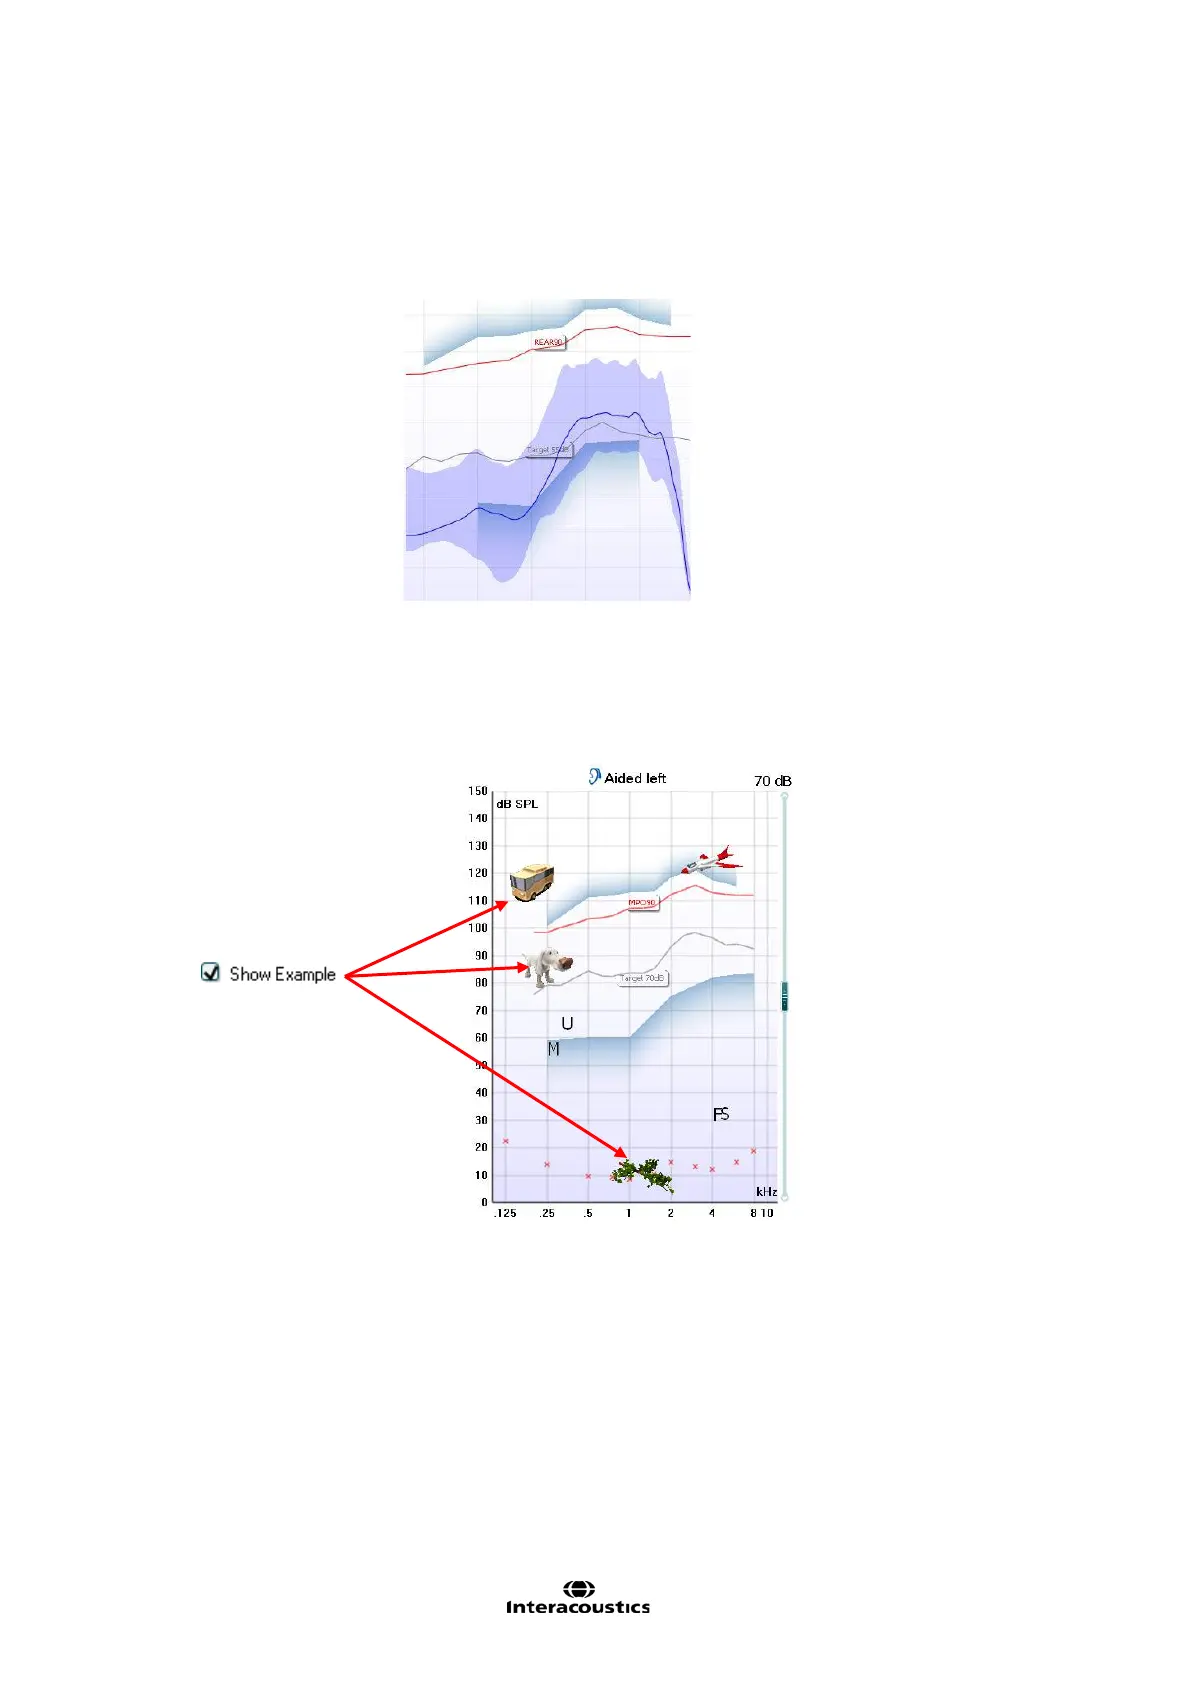
2.12.3 Show Examples
Tick Show Examples and show the speech area together with sound examples from real life like a dog
barking or the wind rustling leaves.