Affinity
2.0
Additional Information Page 82
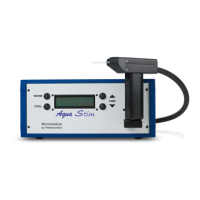
Channel 1 Channel 2
7) In Settings – representation you can choose between Table Mode and Graph Mode.
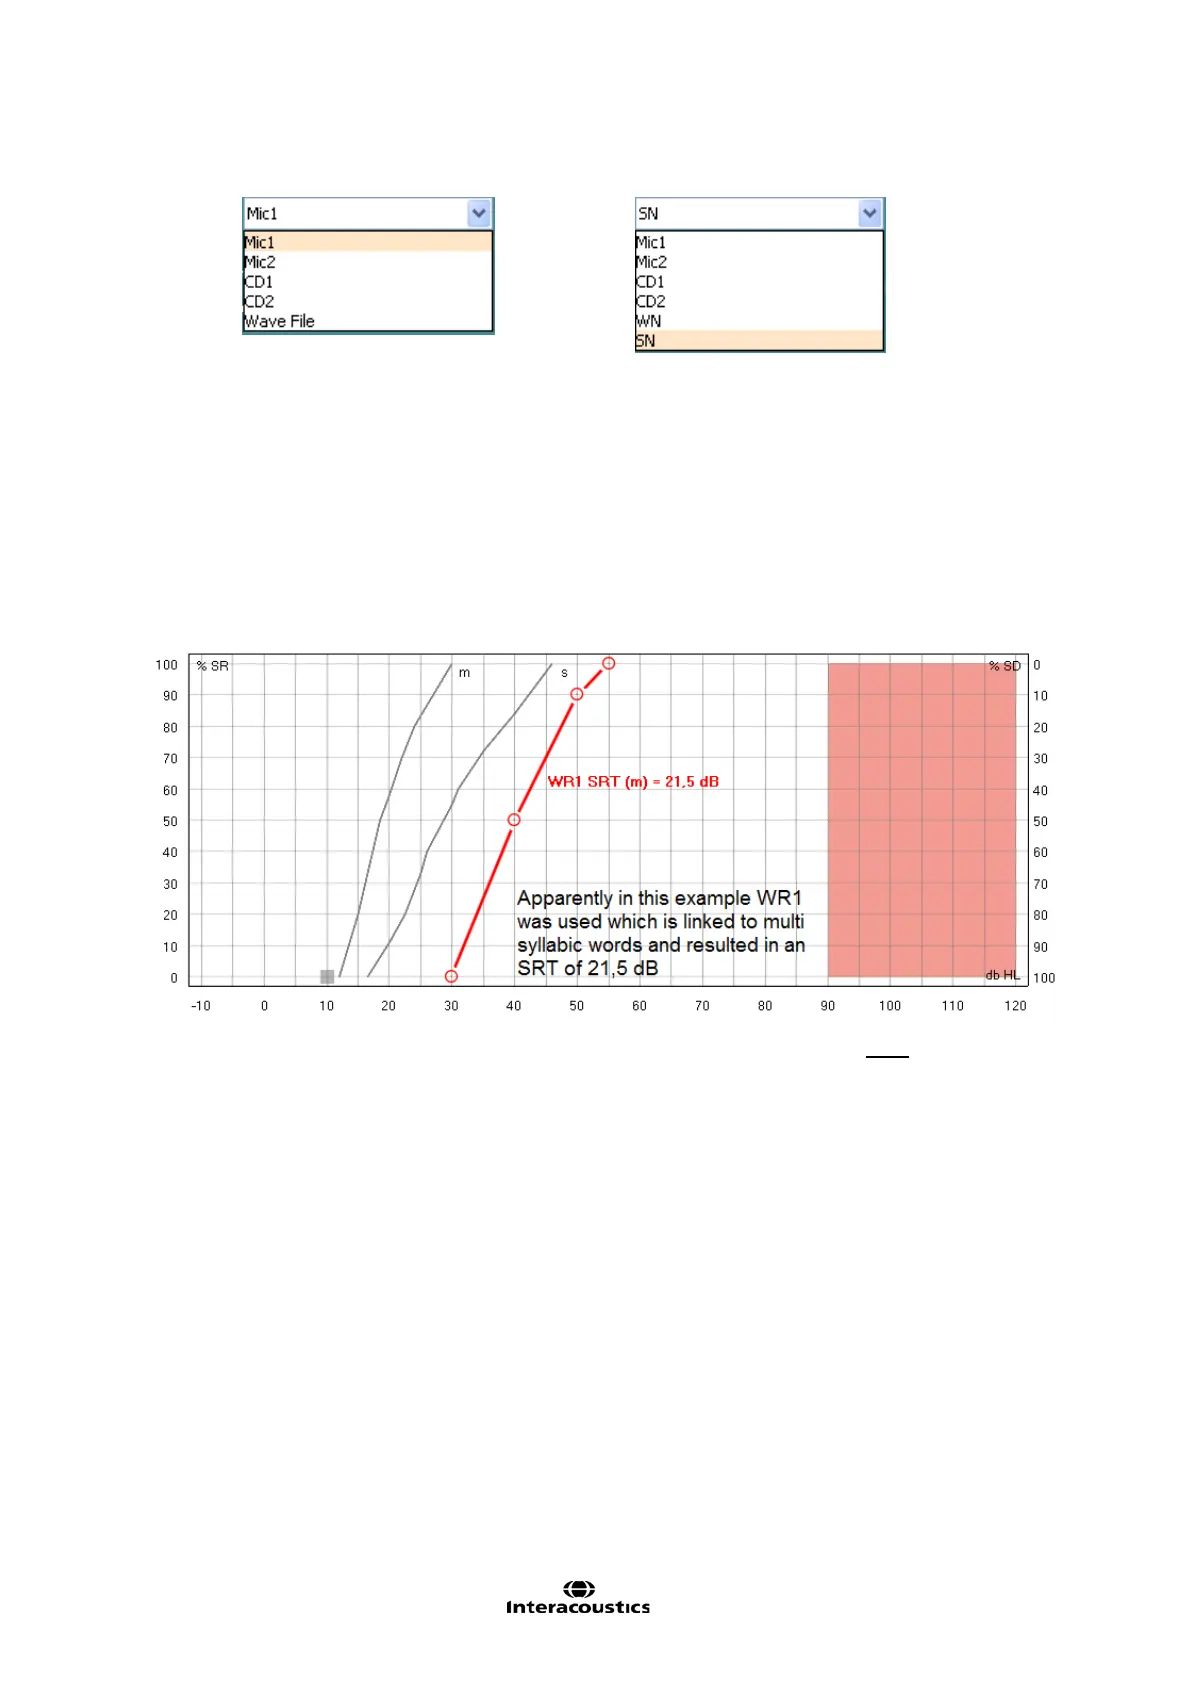
Graph Mode: If selecting Graph Mode the results are displayed in a graph.
Show SRT on speech audiogram calculates the SRT value based on the norm curve (the
distance in dB from the point where the norm curve crosses 50% to the point where the
speech curve crosses 50%) like shown below. The result is then an expression of how much
you need to turn up the level compared to normal in order for the patient to be able to repeat
50%.
The calculation is based on the m curve if using multi syllabic words and the s curve if using
single syllabic words.
Note that the norm curves change based on the speech material. You must therefore ensure
that WR1, WR2 and/or WR3 is linked to single or multisyllabic words to show the SRT (see
section
1.7.2.3). If no stimulus is linked to the WR curves, no SRT will be shown on the
speech screen.
Table Mode: If selecting Table Mode the test results are displayed in a table.
When clicking “store” the intensity level is shown in the table. Unlike Graph mode no
calculation of the SRT takes place. The table mode records the level at which you found the
SRT.
When changing Transducer, Test Type (HL, MCL, UCL), and Aided (Aided or Binaural) a new
SRT is recorded.