Viewing the Snapshot
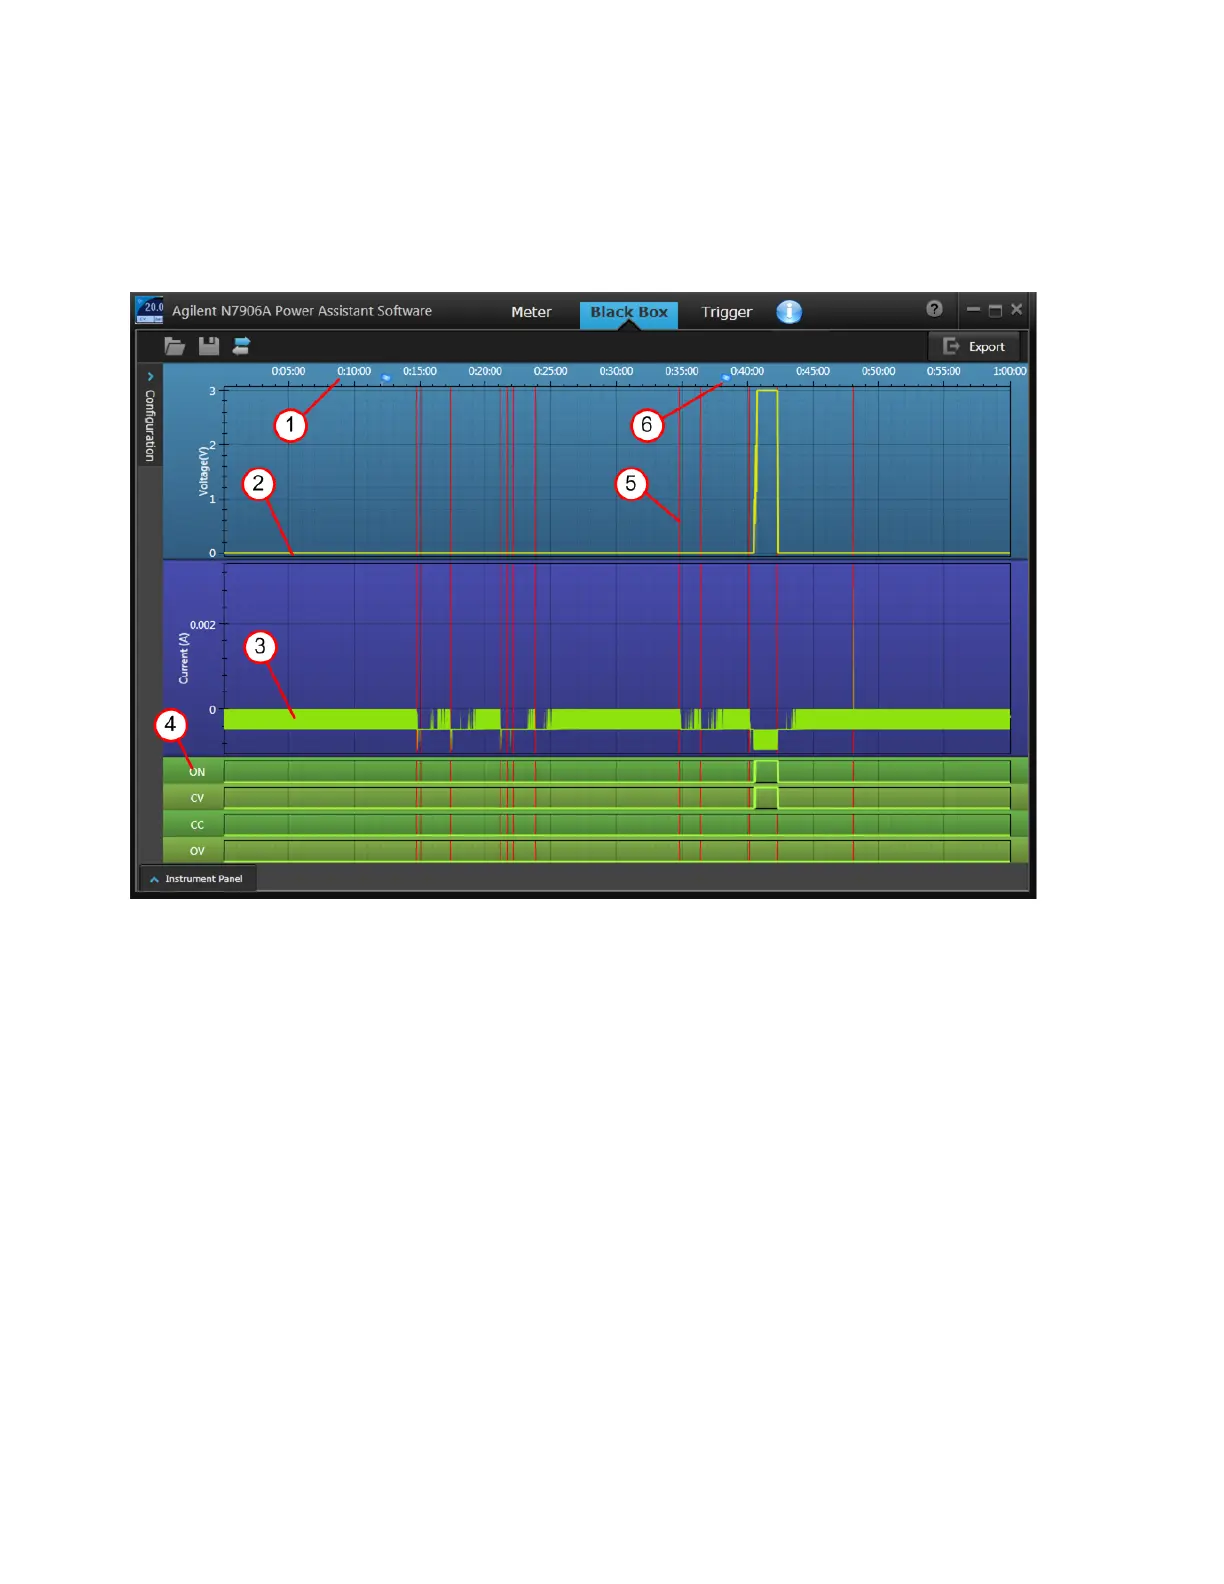
The Black Box tab displays the snapshot data file that you retrieved from the instrument. The snapshot
always uploads from the most recent data entry on back. The following figure illustrates a sample
snapshot file:
Note the following areas of interest:
1. The area on top of the display indicates the total time period of the snapshot
2. The yellow line is the output voltage.
3. The green line is the output current.
4. The green portion of the window displays the status states.
5. The vertical red lines indicate when power was cycled on or off.
6. The pale blue dots on the timeline indicate where a user-defined message was placed into the log
(see Viewing Snapshot Events).
Configuring the Display
Not all of the snapshot data can be displayed on the window at the same time. You can decide which
data you wish to view.
Keysight N6900/N7900 Series Operating and Service Guide 199
5 Using the Power Assistant Software
 Loading...