The User Interface
131
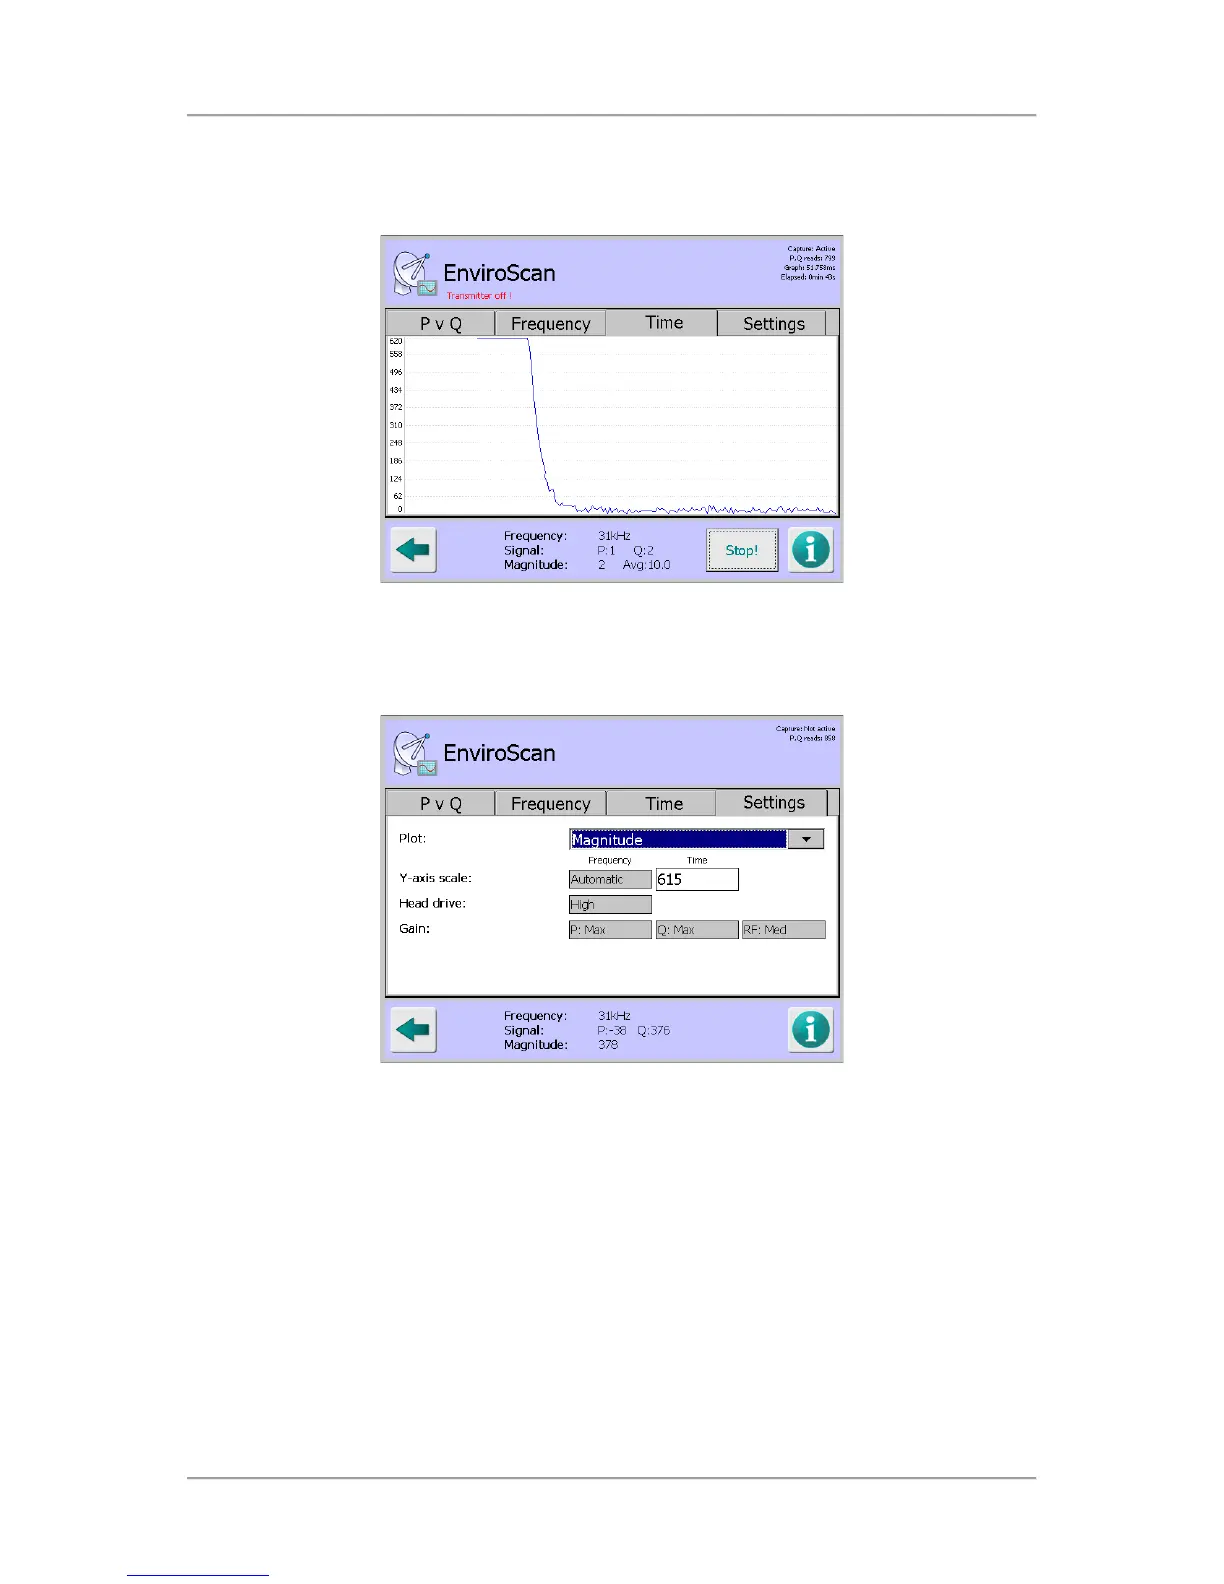
■ Time tab
Tapping on the Capture button with the Time tab selected starts a process that captures the
signal at the currently set frequency and displays a scrolling graph of that signal over time.
Tapping anywhere within the graph pops up the Frequency screen which displays a list of the
70 available frequencies. Tapping on a frequency selects it and closes the screen. The selected
frequency is then used and displayed in the graph.
■
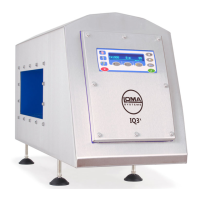
Settings tab
The Settings tab contains and displays the following options and information:
O
Plot
Tap on the arrow to the right of the field to choose an option for displaying the raw P,Q
values, a combination of them or the resultant signal value received directly from the
detector head.
O
Y-axis scale
The Frequency scale used on the graph Y axis in the Frequency tab is displayed. This is
set automatically and is not editable.
The Time scale used on the graph Y axis is in the Time tab is editable by tapping in the
field to display a pop-up numeric keypad screen and then entering a suitable value to be
used for the time scale.