The User Interface
135
■
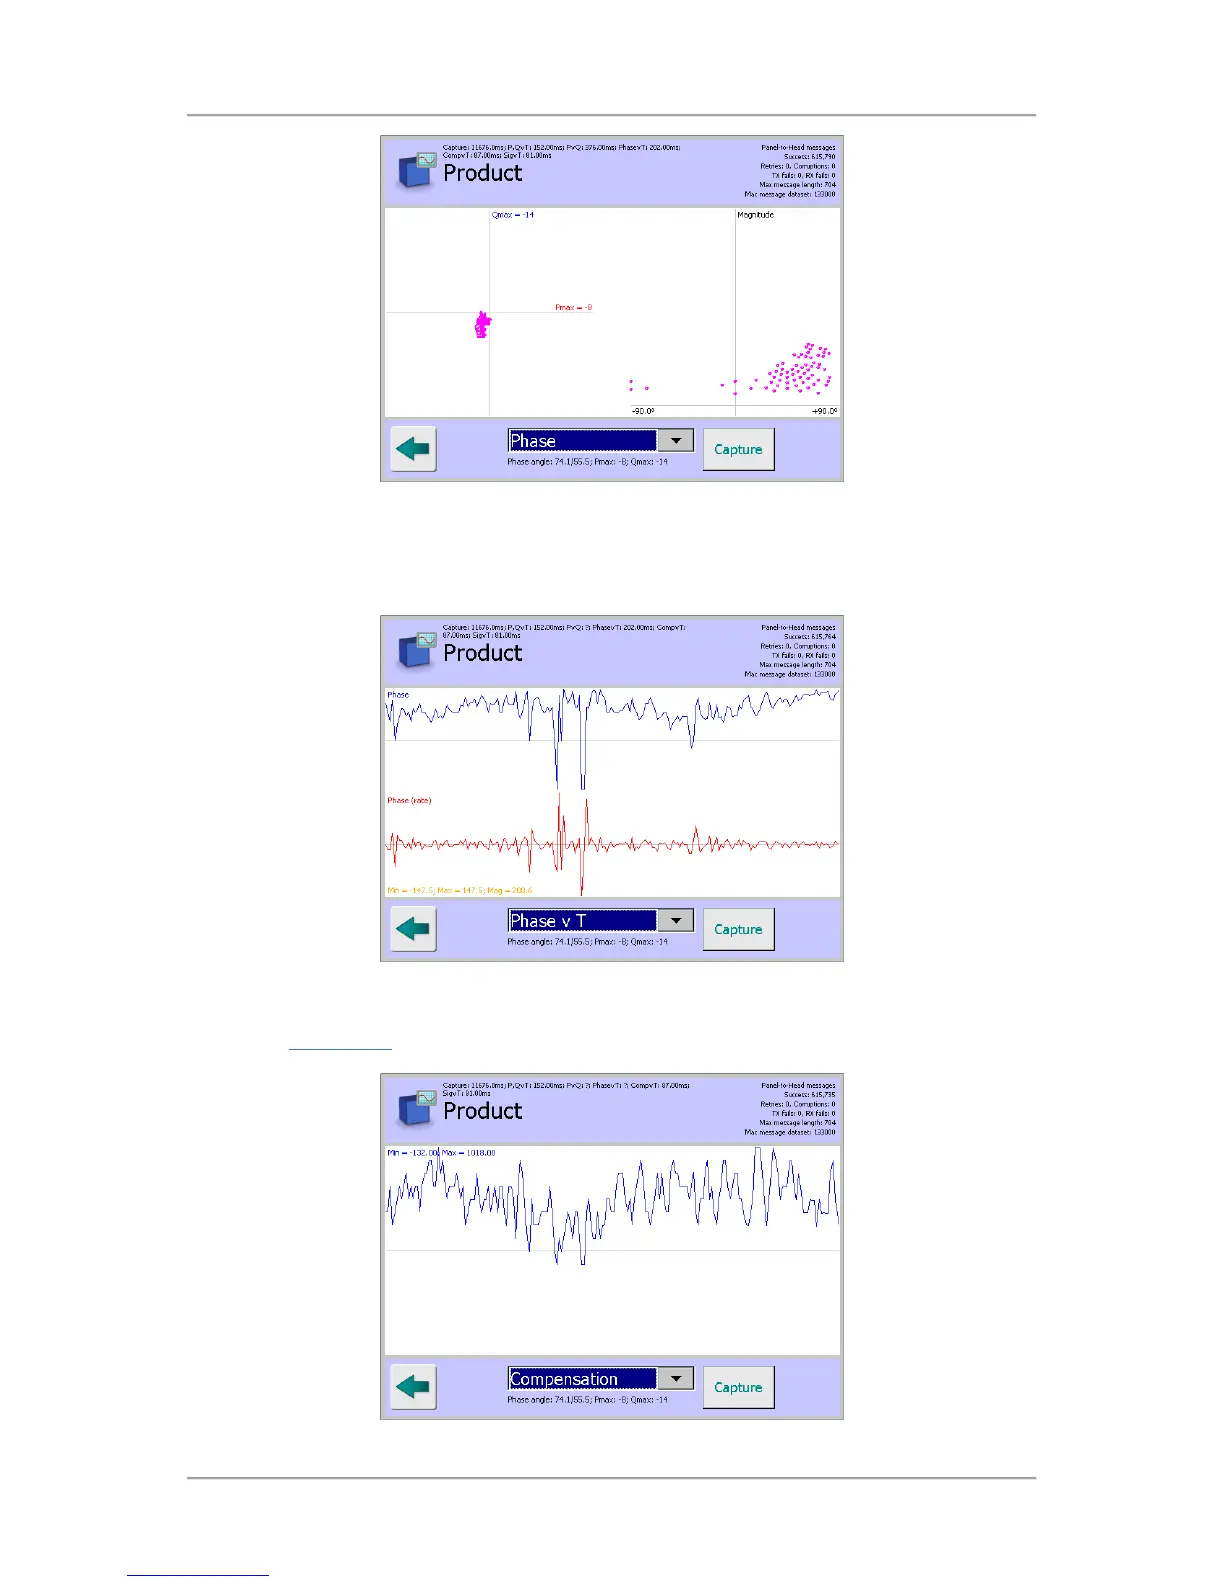
Phase v T screen
The Phase v T screen displays two graphs showing the phase angle and rate of change of the
phase angle against time for the product signal. The Min, Max and Mag (combined) angles are
also displayed.
■
Compensation screen
The Compensation screen displays changes in the product compensation value, initially set up
in the Learn Setup
screen, as the product signal changes over time.
 Loading...