Parameter Monitoring (Waveforms) Operations
5 - 24 046-003777-00 A5/A3™ Operating Instructions
The N
2
O vs. Time waveform can be displayed in the waveform area.
FIGURE 5-25 Example Simulated N
2
O vs. Time Waveform (available with the AG module)
N
2
O vs. Time
The Y-axis of the N
2
O vs. Time waveform is labeled N
2
O . The unit of measure is %. You can adjust
the scales of the Y-axis (See “Gas Scales (software bundle version 02.06.00 and later, with an AG
module connected)” on page 3-37.). Though the X-axis is not labeled, it represents a time scale of
0 to 15 seconds.
O
2
vs. Time waveform can be displayed in the waveform area.
FIGURE 5-26 Example Simulated O
2
vs. Time Waveform (available with the AG module)
O
2
vs. Time
The Y-axis of the O
2
vs. Time waveform is labeled O
2
. The unit of measure is %. You can adjust the
scales of the Y-axis (
See “Gas Scales (software bundle version 02.06.00 and later, with an AG
module connected)” on page 3-37.). Though the X-axis is not labeled, it represents a time scale of
0 to 15 seconds.
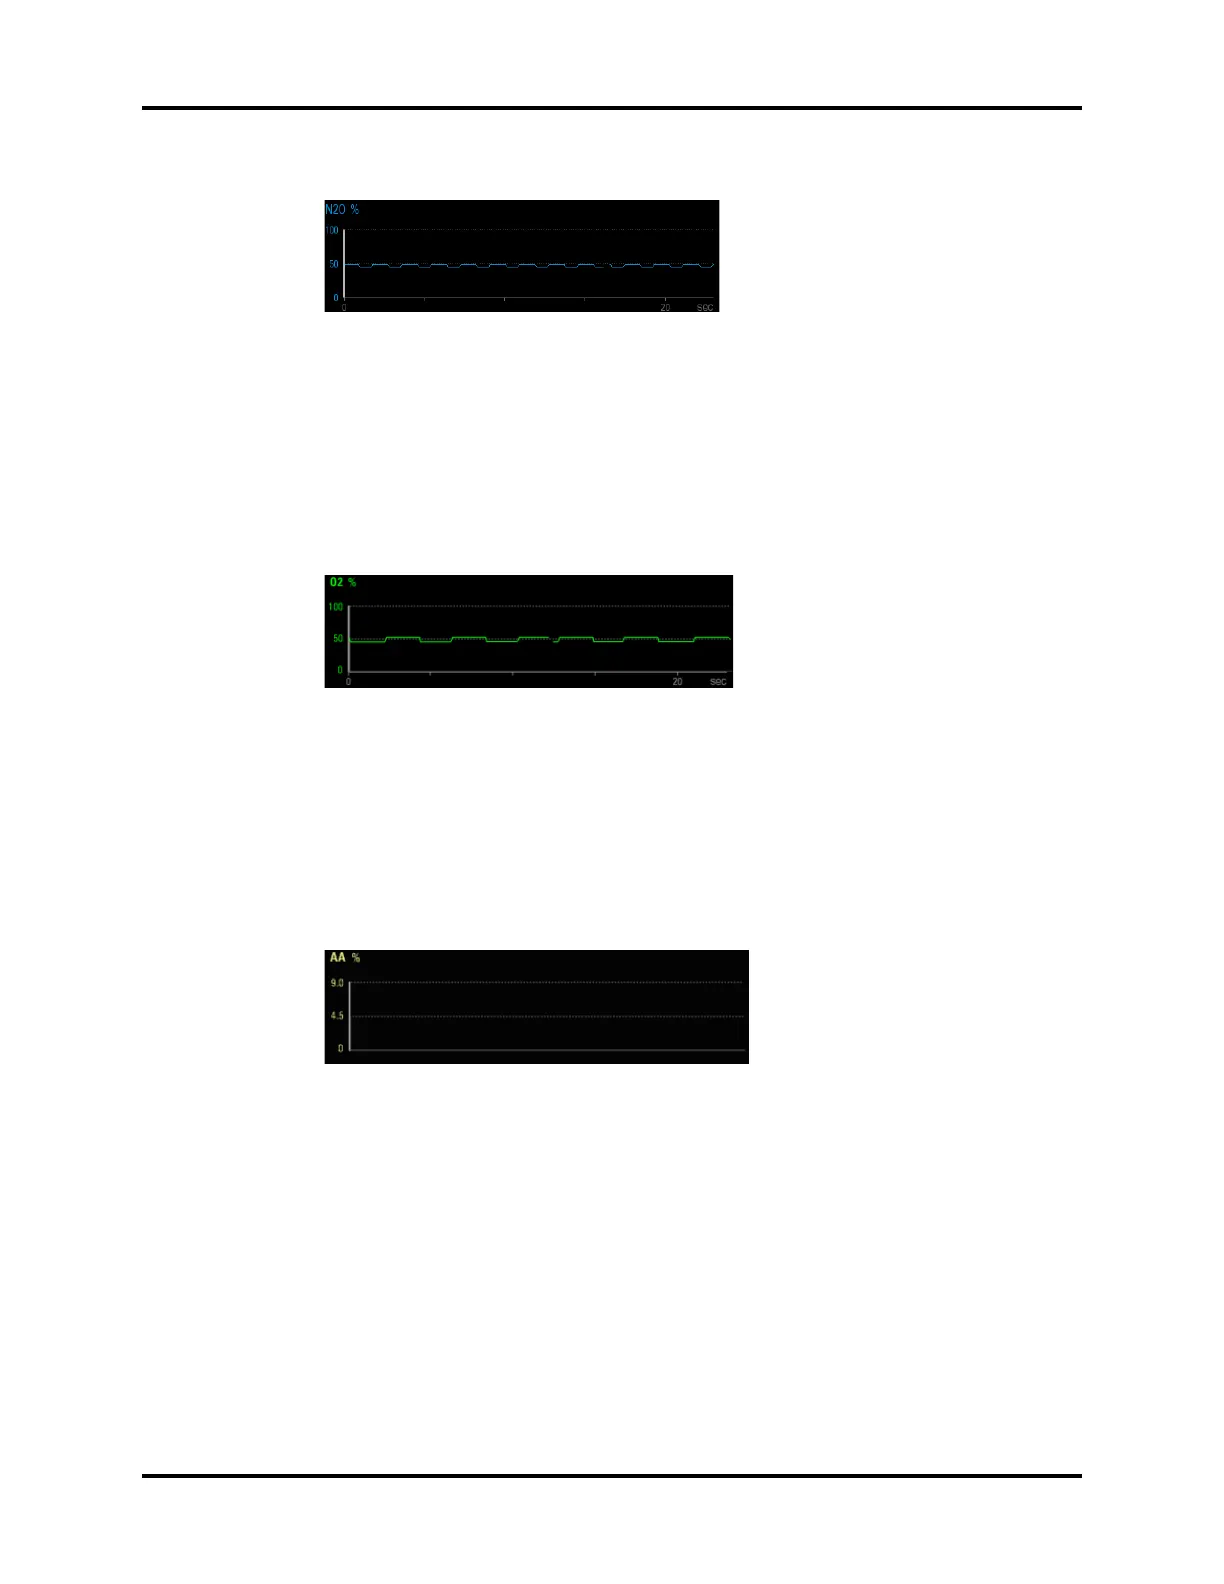
AA vs. Time waveform can be displayed in the waveform area.
FIGURE 5-27 Example Simulated AA vs. Time Waveform (available with the AG module)
AA
vs. Time
The Y-axis of the AA vs. Time waveform is labeled AA
. The unit of measure is %. You can adjust
the scales of the Y-axis (
See “Gas Scales (software bundle version 02.06.00 and later, with an AG
module connected)” on page 3-37.). Though the X-axis is not labeled, it represents a time scale of
0 to 15 seconds. If no agent is detected, the system displays AA vs. Time waveform (see FIGURE 5-
27). If an anesthetic agent such as sevoflurane is detected, the system displays Sev vs. Time
waveform (see FIGURE 5-28).