FLIPR
®
Tetra High Throughput Cellular Screening System User Guide
0112-0109 H 275
done in real time and no resulting data will be stored. it is
recommended to test this correction during assay optimization.
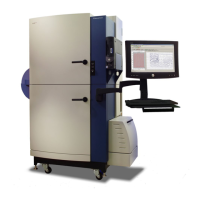
Spatial Uniformity Correction
The spatial uniformity correction algorithm compensates, to a certain
extent, for of the above-mentioned variations using a correction factor
applied to all plate wells and samples.
Determining Spatial Uniformity Correction
The correction factor is derived by calculating the mean fluorescence
counts of all wells at Sample 1, see below:
Sample Time
Well
A1
– Ctrl
A2
– Ctrl
A3
– Ctrl
A4
Exp
A5
Exp
A6
Exp
A7
+ Ctrl
A8
+ Ctrl
A9
+ Ctrl
1 0 8000 8500 9500 8200 9200 8800 10000 9500 8700
Mean (A1-A9) 8933
Spatial Uniformity Correction Factor Calculation (Mean/Well)
Well-
Specific
Correction
Factor
A1 A2 A3 A4 A5 A6 A7 A8 A9
1.12 1.05 0.94 1.09 0.97 1.02 0.89 0.94 1.03
Note: In actual practice, data from all 96 wells are included in the
calculations, but in this example, data from only nine wells are
presented, to simplify the example.
 Loading...