NTI ENTERPRISE ENVIRONMENT MONITORING SYSTEM
38
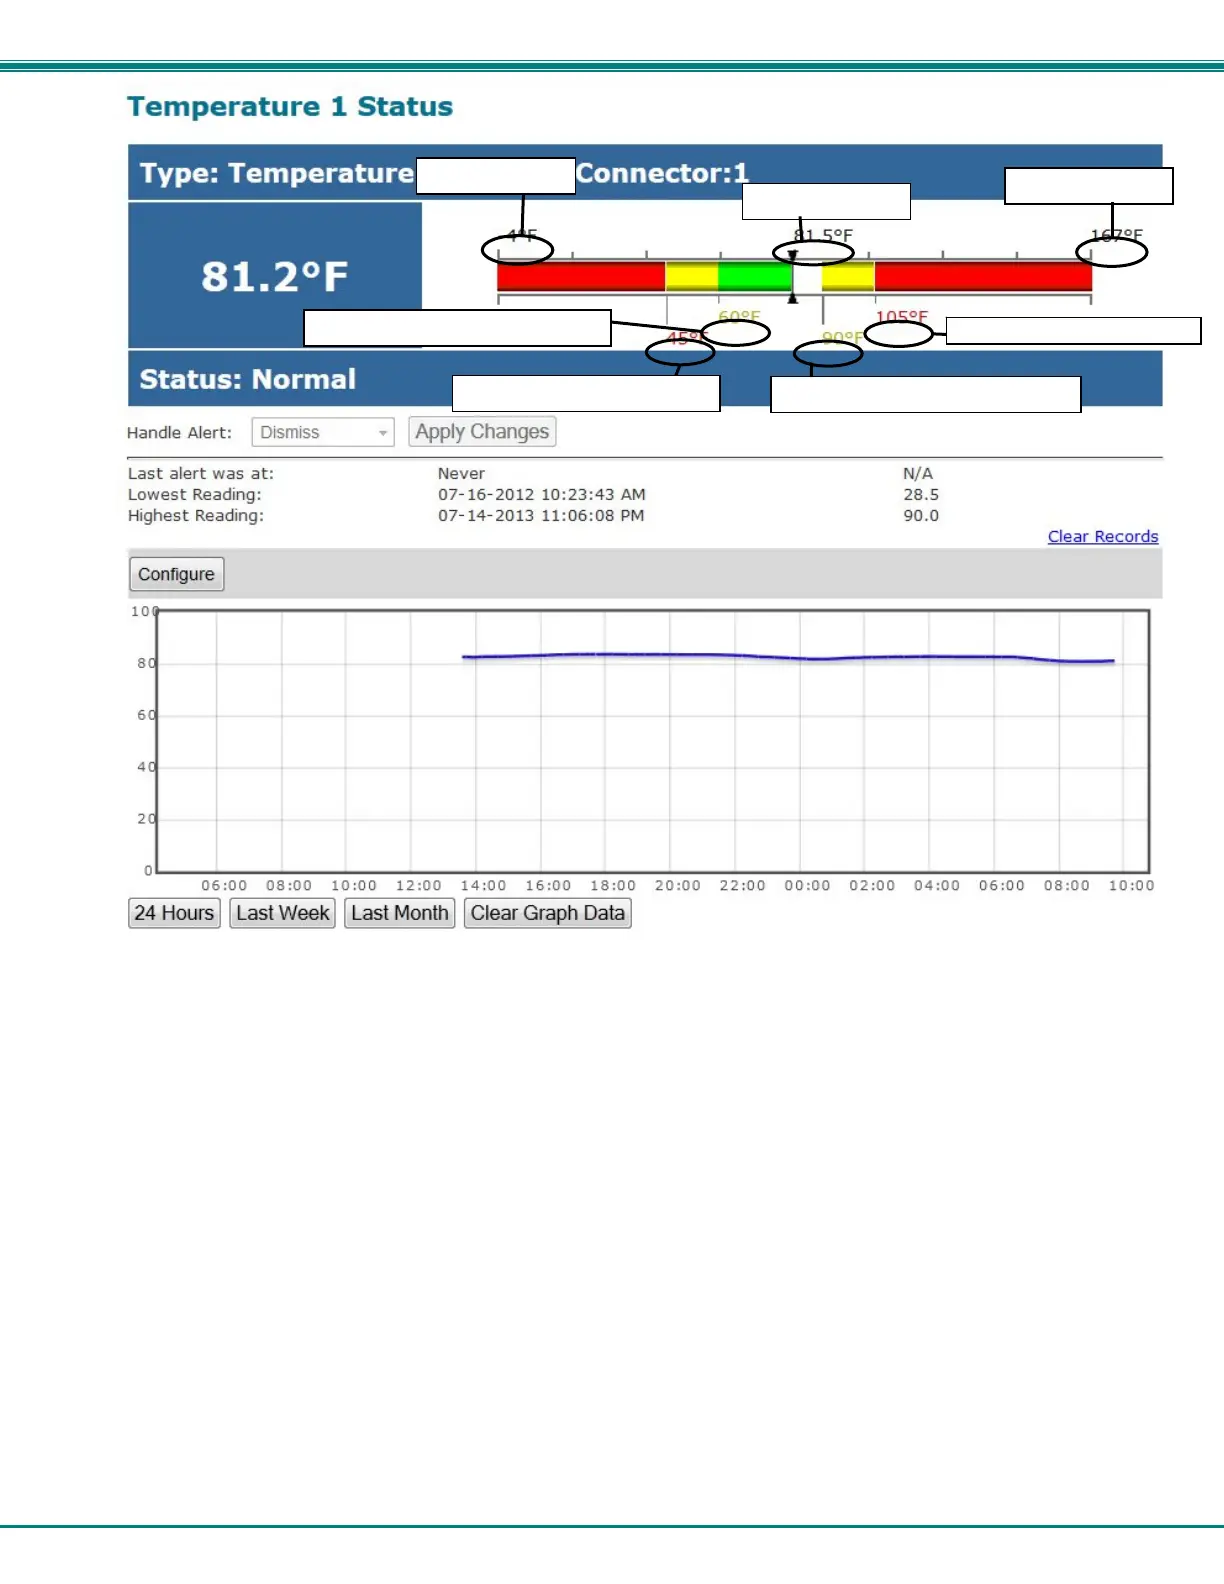
Figure 36- External Sensor Reading
If the sensor is in alert status, the user has the option to either acknowledge the alert or dismiss it. If the user acknowledges
the alert, no additional alert messages will be sent during that alert status cycle. If the user dismisses the alert, another alert
message will be sent once the “notify again after” time designated on the configuration page elapses.
The Configure button allows the user to configure parameters of the sensor.
When enabled, a graph that shows a history of a sensor’s readings is displayed (RS485, TACH and IP sensors only). The time
period displayed can be changed to show the last hour, last week or last 30 days.
Note: If the ENVIROMUX is power-cycled, all history of sensor readings will be cleared.
Note: In a cascaded configuration, only the sensors connected to the master unit will display graphs. To view the graph
of a slave sensor you need to log into that slave unit directly.
The range of readings displayed will adjust as the readings are taken. For example, in the above image, for the time period
displayed the range of readings was between 82.2°F. to 80.2°F. As the readings vary and the time period increases, the range
will automatically update to a wider range of temperatures and adjust the graph accordingly.
To clear the readings for a sensor and start over, click on “Clear Graph Data”. To disable the viewing of graphs, see page 70.
Note: If the sensor is a multi-function sensor (i.e. E-STHS), then using “Clear Graph Data” will clear the data for both the
temperature and humidity readings of that sensor.
minimum level
minimum non-critical threshold
maximum level
minimum critical threshold
maximum critical threshold
maximum non-critical threshold
center of ran
e
 Loading...