SLT12 User Manual
137
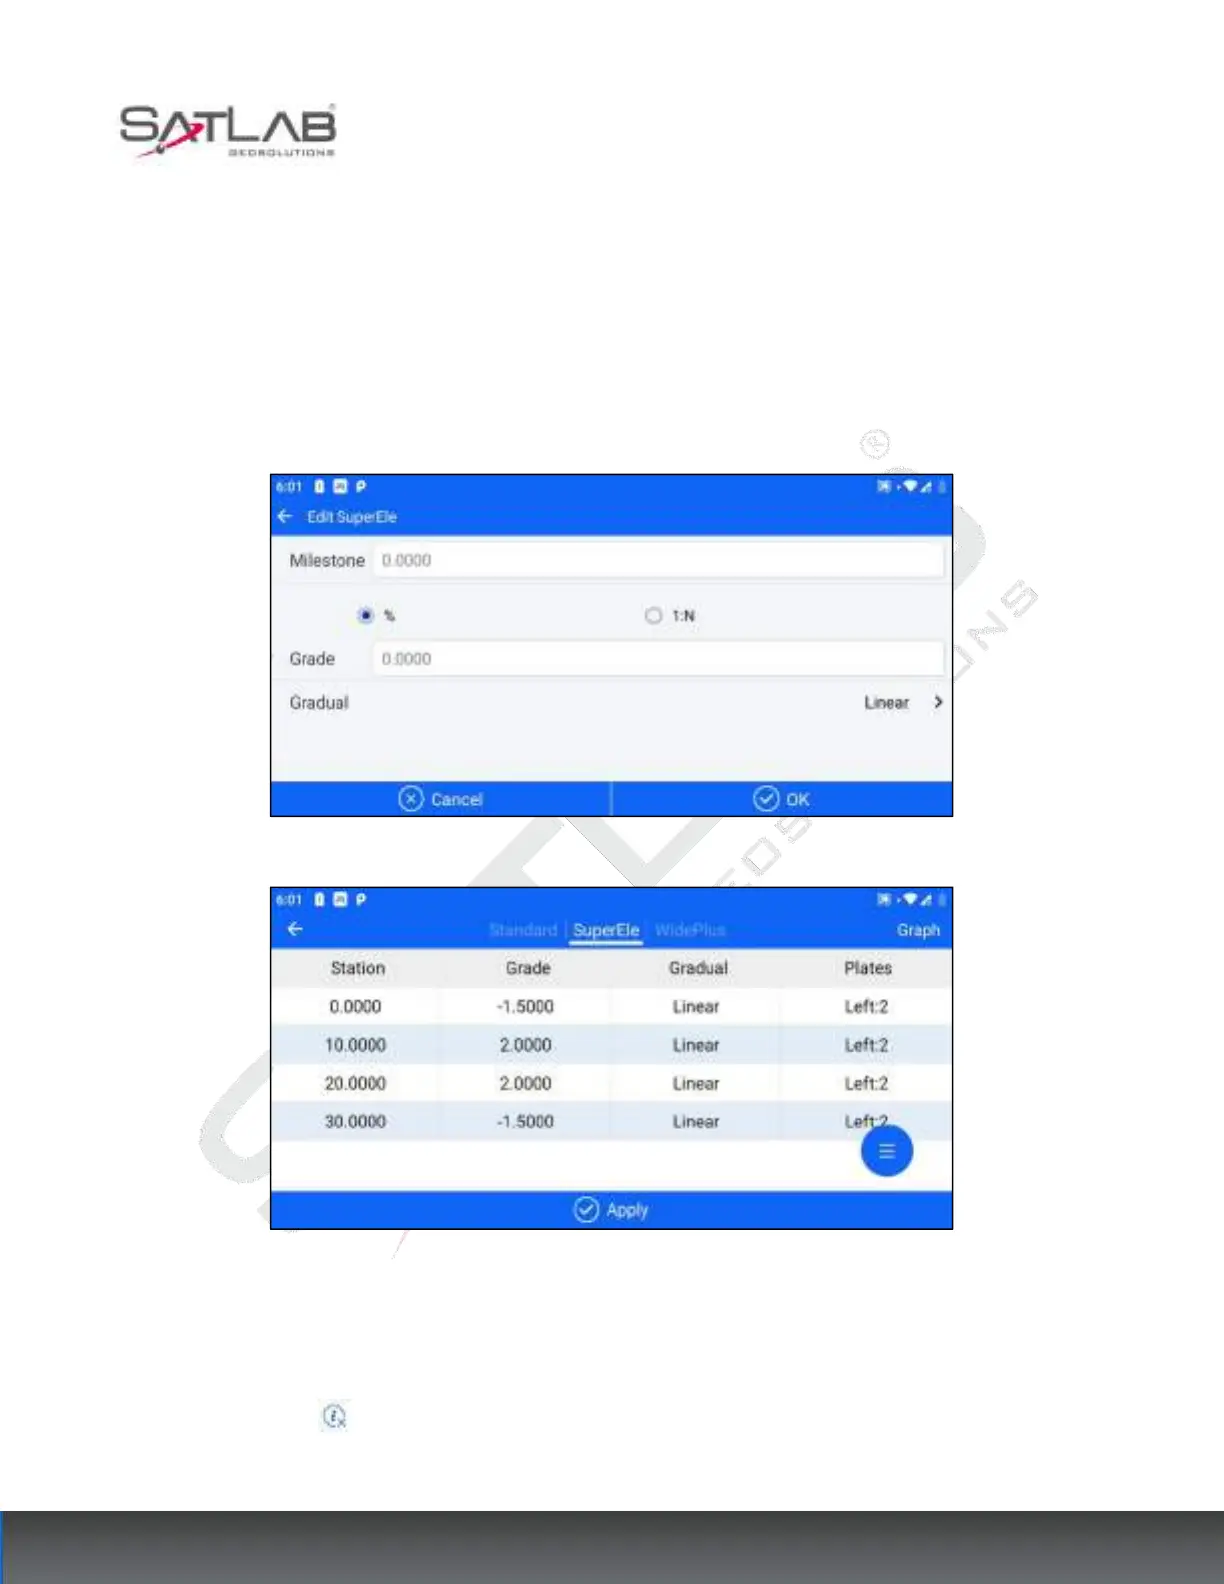
To simplify the example, we assume that the ultra-high change points on the drawing read as follows.
Superelevation Change Point 1: Mileage 0 Slope -1.5%
Superelevation Change Point 2: Mileage 10 Slope 2%
Superelevation Change Point 3: Mileage 20 Slope 2%
Superelevation Change Point 3: Mileage 30 Slope -1.5%
Figure 11- 25
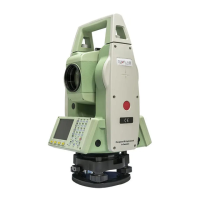
Figure 11- 26
Finish adding the four Superelevation points in turn, and you can view them correspondingly in the [Graph]
screen.
Click "Cross Section" to view the cross-section height information of the current location corresponding to
the mileage.