Display
● Total runtime
The values in the bar diagram are specified in %, relative to the set maximum cycle
monitoring time.
Its numeric magnitude is displayed under the bar.
– Mean value
Mean value of the actual value in % (TOTALPER block parameter)
– Actual value
Mean value of all net run times in % OB3x/OB8x + OB1 (TOTALCUR block parameter)
– Max. value
Formed from the net run times in % of all the OB3x/OB8x + OB1 net run times from the
most recent cycle (TOTALMAX block parameter)
– Min. value
Formed from the net run times in % of all the OB3x/OB8x + OB1 net run times from the
most recent cycle (TOTALMIN block parameter)
● Horizontal bar diagrams for OB3x
The values refer to the respective OB cycle time.
The graphic display of the OB3x times is expanded by an indicator that signals buffered
and lost start events.
– Net value
– Gross value
– Start event lost
● Horizontal bar diagrams for OB8x and OB1
The values refer to the configured maximum cycle monitoring time.
– Net value
● Scan rate:
Display of the scan rate for all cyclical OBs of the user program
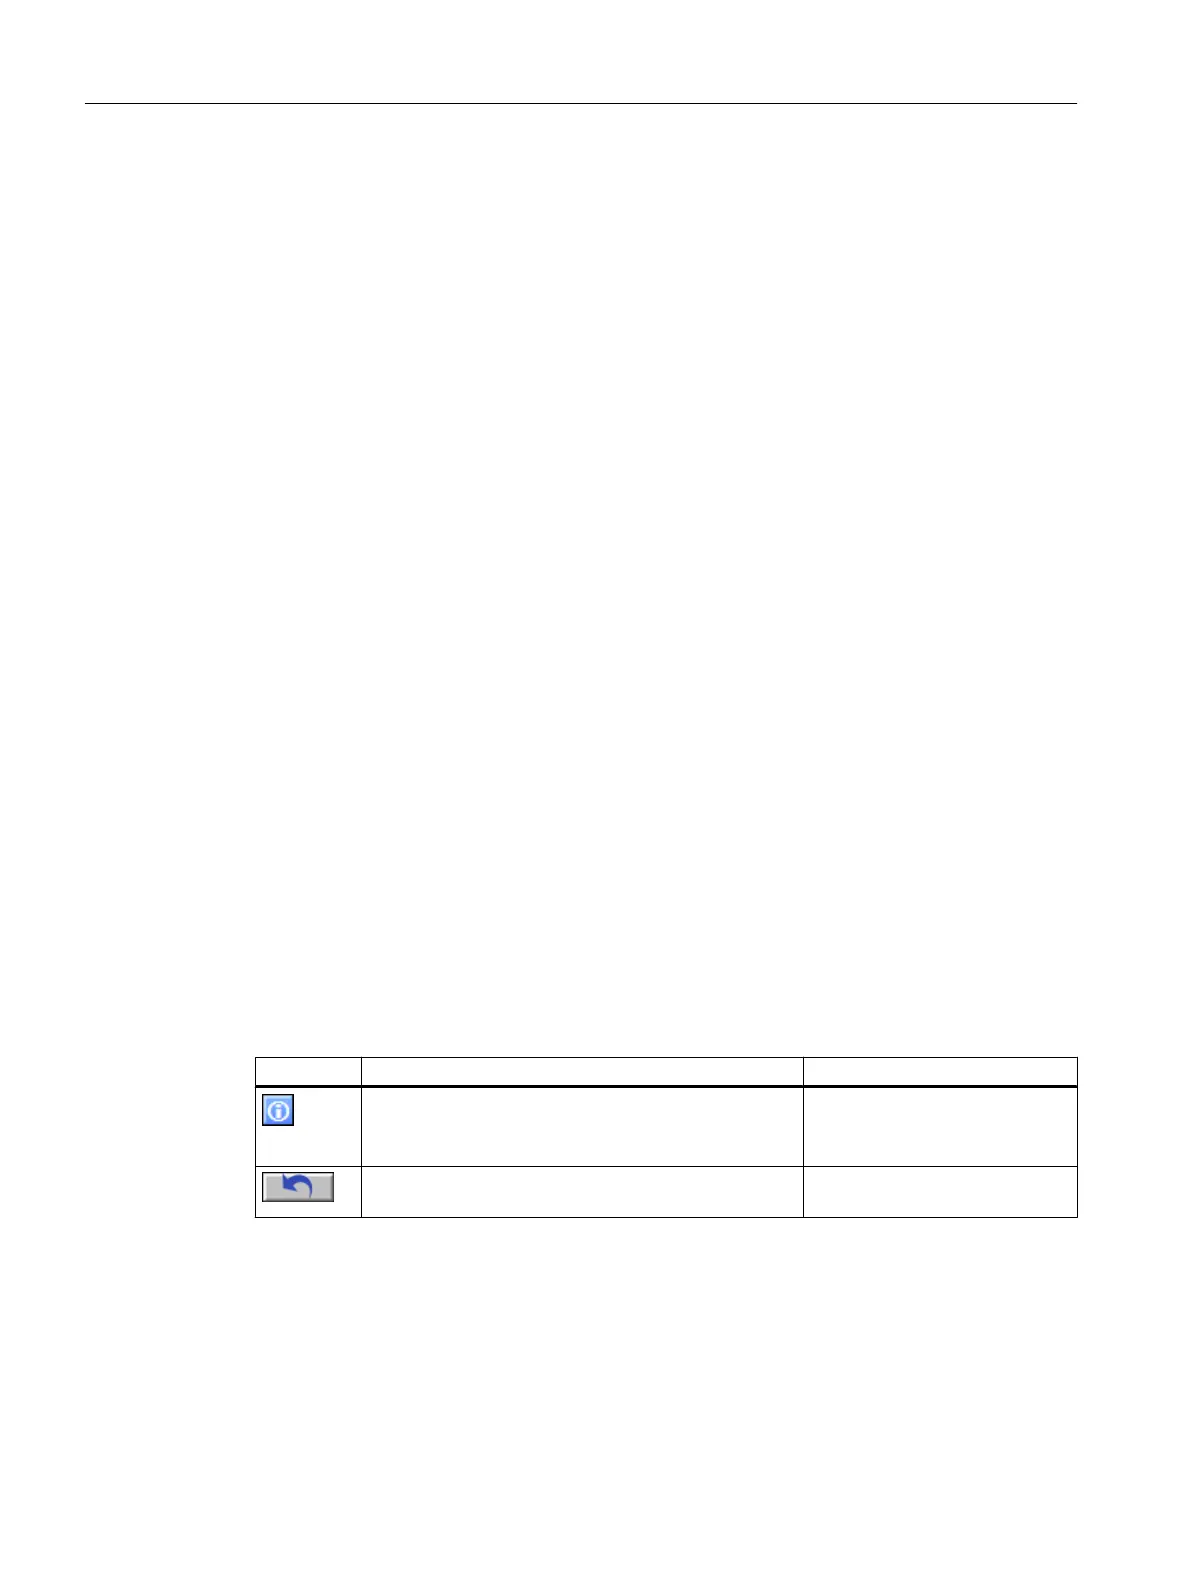
Operator control
Icon Explanation Permission
You open the legend by clicking the icon.
The legend shows the icons designating the possible
statuses and their meaning.
No access protection
You reset the values by clicking the icon. "Process controlling" for the di‐
agnostics area
Operator control and monitoring
6.11 Faceplate
Maintenance Station
162 Function Manual, 03/2016, A5E36187641-AA
 Loading...