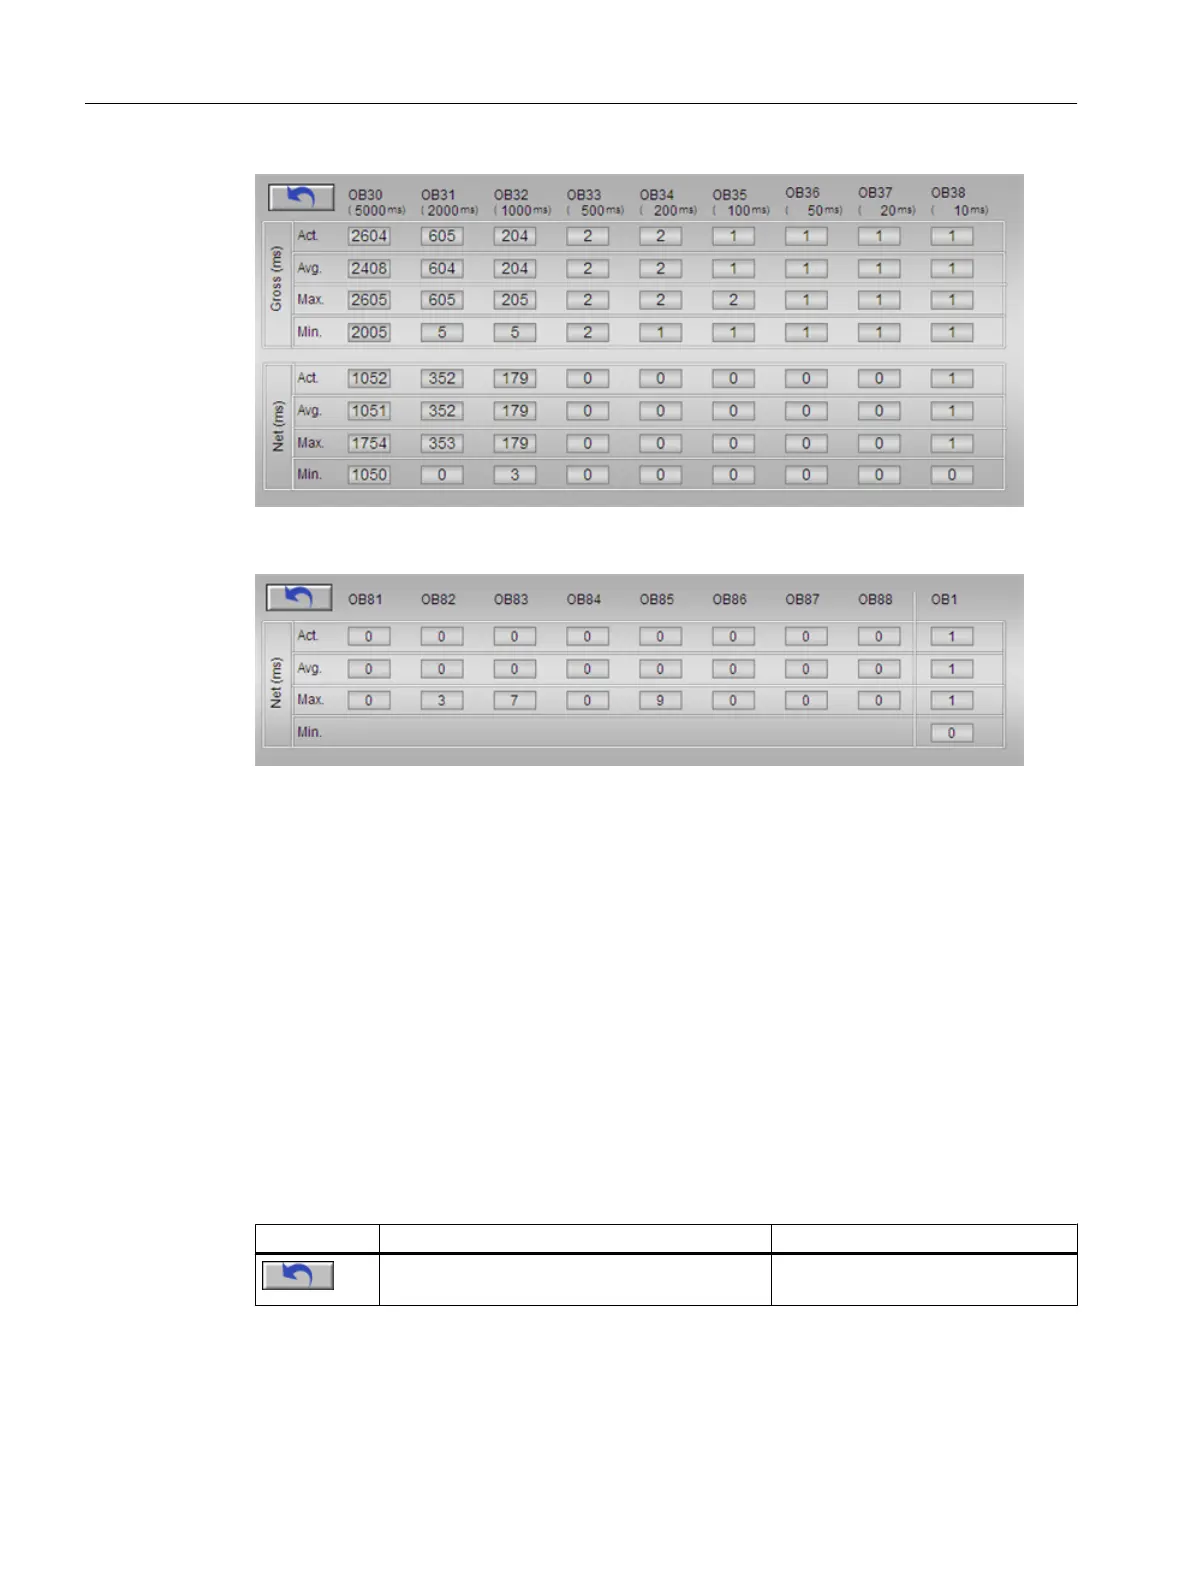
The figure shows an example of the "OB8x/OB1" view.
Display
● The utilization of the OB3x organization blocks is shown in the "OB3x" view:
– The absolute gross and net value, and the average value over a number of cycles of
the OB 3x, related to the configured maximum cycle monitoring time of the OB in each
case.
– The minimum and maximum values reached since the last reset of the OBs
● The utilization level of the OB8x organization blocks is shown in the "OB8x/OB1" view:
– The absolute net value and the average value over a number of cycles of the OB8x and
OB1, related to the configured maximum cycle monitoring time of the OB in each case.
– The minimum and maximum values reached since the last reset of the OBs.
Operator control
Icon Explanation Operator permission
You reset the counter values by clicking the icon. "Process controlling" for the diagnos‐
tics area
Operator control and monitoring
6.11 Faceplate
Maintenance Station
164 Function Manual, 03/2016, A5E36187641-AA
 Loading...