and the measurement results are expressed
in decibels (the result is related to the values
set in the Reference Levels screen (path:
<Menu> / Auxiliary Setup /
Reference Levels).
Note: In Vibration modes, results can be presented in the Logarithmic (dB) or Linear (for example,
m/s
2
) units. It depends on the Scale parameter value. For example, 10 m/s
2
can be presented also
as 140 dB.
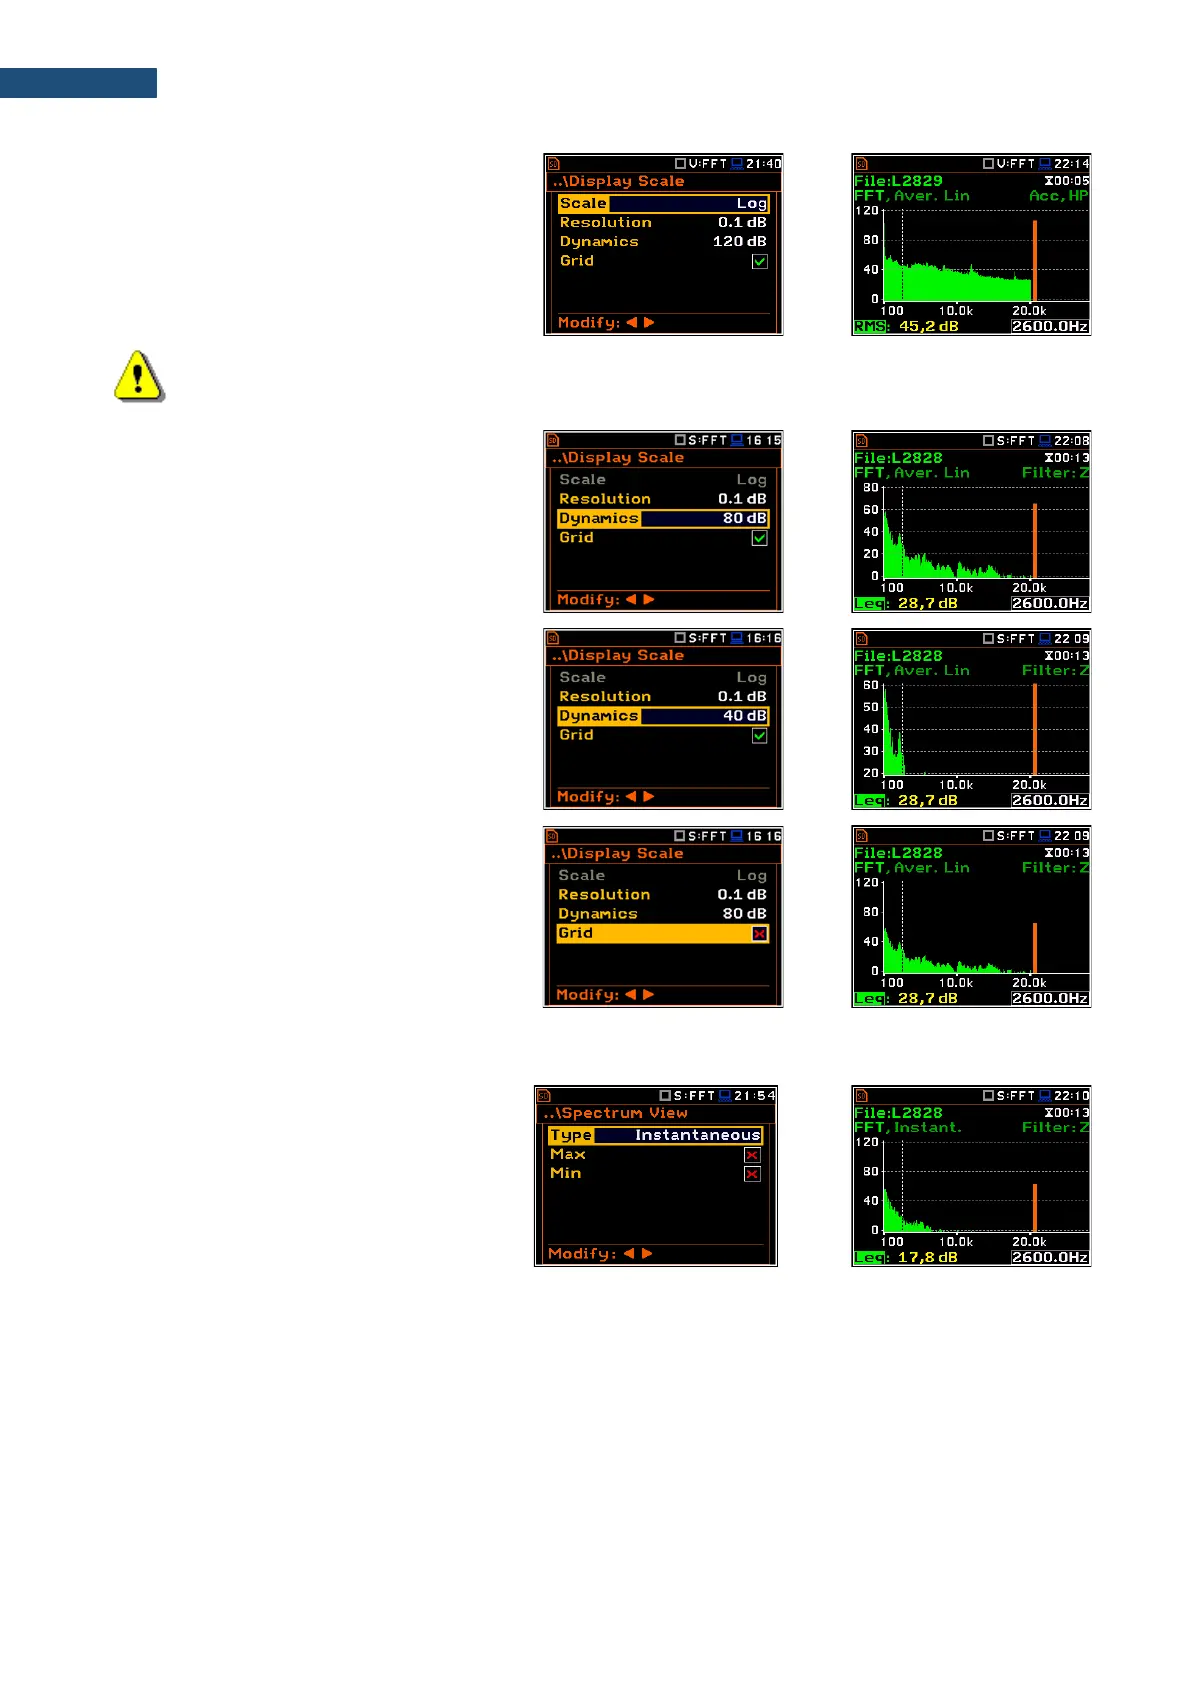
Scaling the vertical axis
The Dynamics parameter defines the
dynamic range of the Y-axis scale.
It is possible to select the range from the set:
10dB, 20dB, 40dB, 80dB, 100dB and 120dB.
Switching grid on/off
The Grid position allows you to toggle the
horizontal grid lines of the logger or spectrum
plot.
11.3.3 Selecting the spectra to be viewed – Spectrum View
In the Spectrum View screen, you can select
the different spectra to be viewed in the
Spectrum view.
In the Type position, you may choose the
spectrum type to be presented as a bar plot:
• Instantaneous, obtained for the one FFT sample,
• Averaged, obtained as averaging of instantaneous spectra for the elapsed time [0, Integration Period],
• Max, obtained as maximum instantaneous spectrum for the elapsed time [0, Integration Period] or
• Min, obtained as minimum instantaneous spectrum for the elapsed time [0, Integration Period].