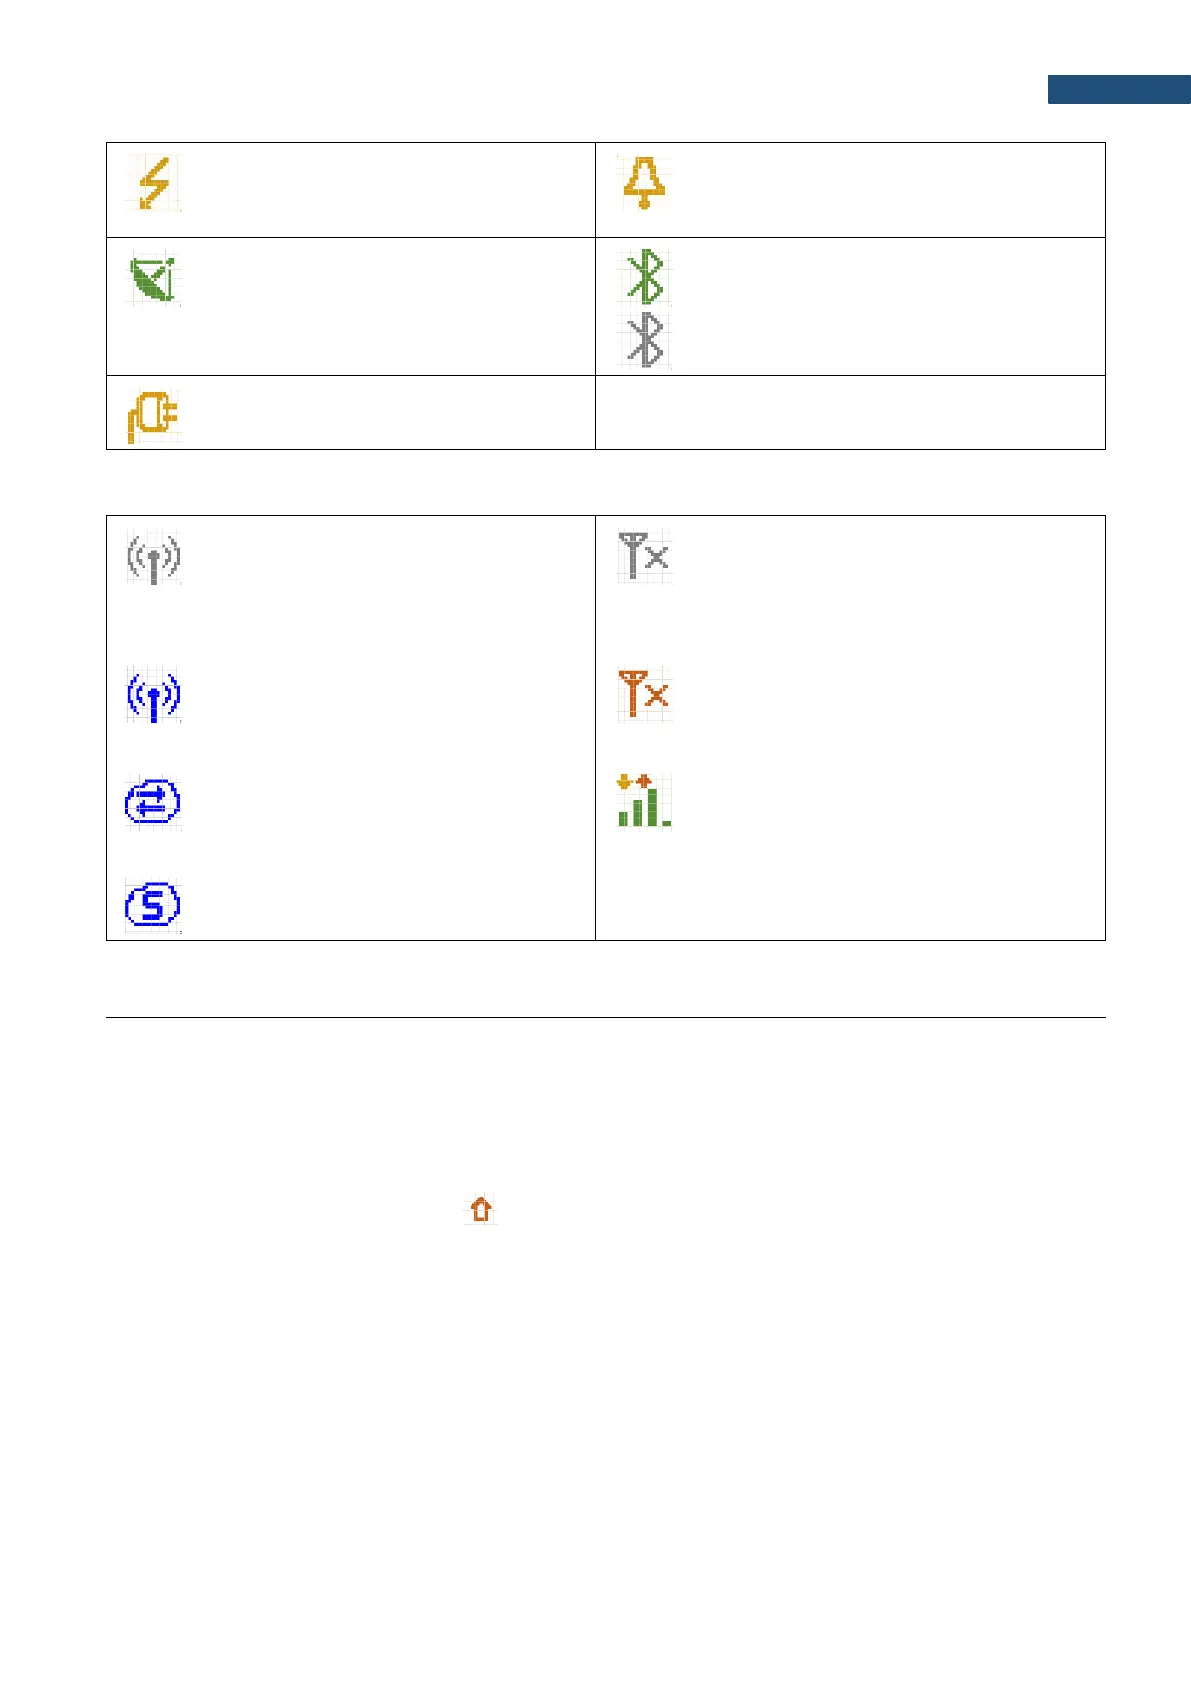
“lightning” icon is displayed when
polarisation voltage is 200V.
“alarm” icon is displayed when an alarm
appears.
„GPS” icon is displayed when GPS is
active. Colours of the icon define the state
of the GPS: green – active, blue –
searching, grey – disconnected.
“Bluetooth” icon is displayed when the
Bluetooth
®
is switched on. Color of the icon
defines state of the connection: green –
connected, grey – disconnected.
“plug” icon is displayed if an external
power is connected to the 7-16V socket.
Icons connected with modem functionality:
“no wireless” icon is displayed when the
GPRS function is switched on and there is
no cable connection with the modem
“no range” icon is displayed when the GPRS
function is switched on and there is no cable
connection with the modem and therefore no
range
“wireless” icon is displayed when the
wireless transmission (GPRS modem) is
active, but there is no connection with Host
or SvanNET
“no range” icon is displayed when the
wireless transmission (GPRS modem) is
active, but the modem is out of range
“host” icon is displayed if there is
connection with Host
“range” icon is displayed if there is GPRS
connection and shows the level of the GPRS
signal and ways of data transmission.
“SvanNET” icon is displayed if there is
connection with SvanNET.
2.10 OVERLOAD AND UNDERRANGE DETECTION
Overload detector
The instrument has the built-in overload detectors. Both A/D converter and input amplifier overload conditions
are detected. The overload in the measurement channel (in its analogue part) and the overload of the
analogue / digital converter are both detected. The “overload” indication appears when the input signal amplitude
is 0.5 dB above the declared “Peak measurement range”. This condition is checked once per second or with the
Logger Step if it is less than 1 second.
An overload is indicating by the flashing icon which is displayed during the period from the overload detection
till the end of the Integration Period. If the overload disappears to the Integration Period end, the overload icon
will not be displayed from the start of the next measurement cycle.
When an overload is detected the special marker will be recorded to the logger file with the data logging step.
The overload time is measured by the OVL result during the Integration Period and is saved in the logger file as
part of Summary Results.