5 CONFIGURING DATA VIEWING – Display
The Display section contains elements for
programming presentation of measurement
result and display parameters.
The content of the Display list depends on
selected measurement function.
The Display section contains following items:
Display Modes allowing you to enable modes of a measurement results presentation (views),
Display Scale allowing you to adjust the scale in graphical views,
Logger View allowing you to select and present results stored in a logger file,
Spectrum View allowing you to select spectra to be viewed; this position becomes available in
the spectrum analyser functions only,
Spectrum Type allowing you to change the spectrum type presented on the display:
acceleration, velocity or displacement; this position appears only in the
spectrum analyser functions in the Vibration mode,
Screen Setup allowing you to set up the brightness and switch on/off the energy saver
function,
Themes allowing you to set the colour theme of the display.
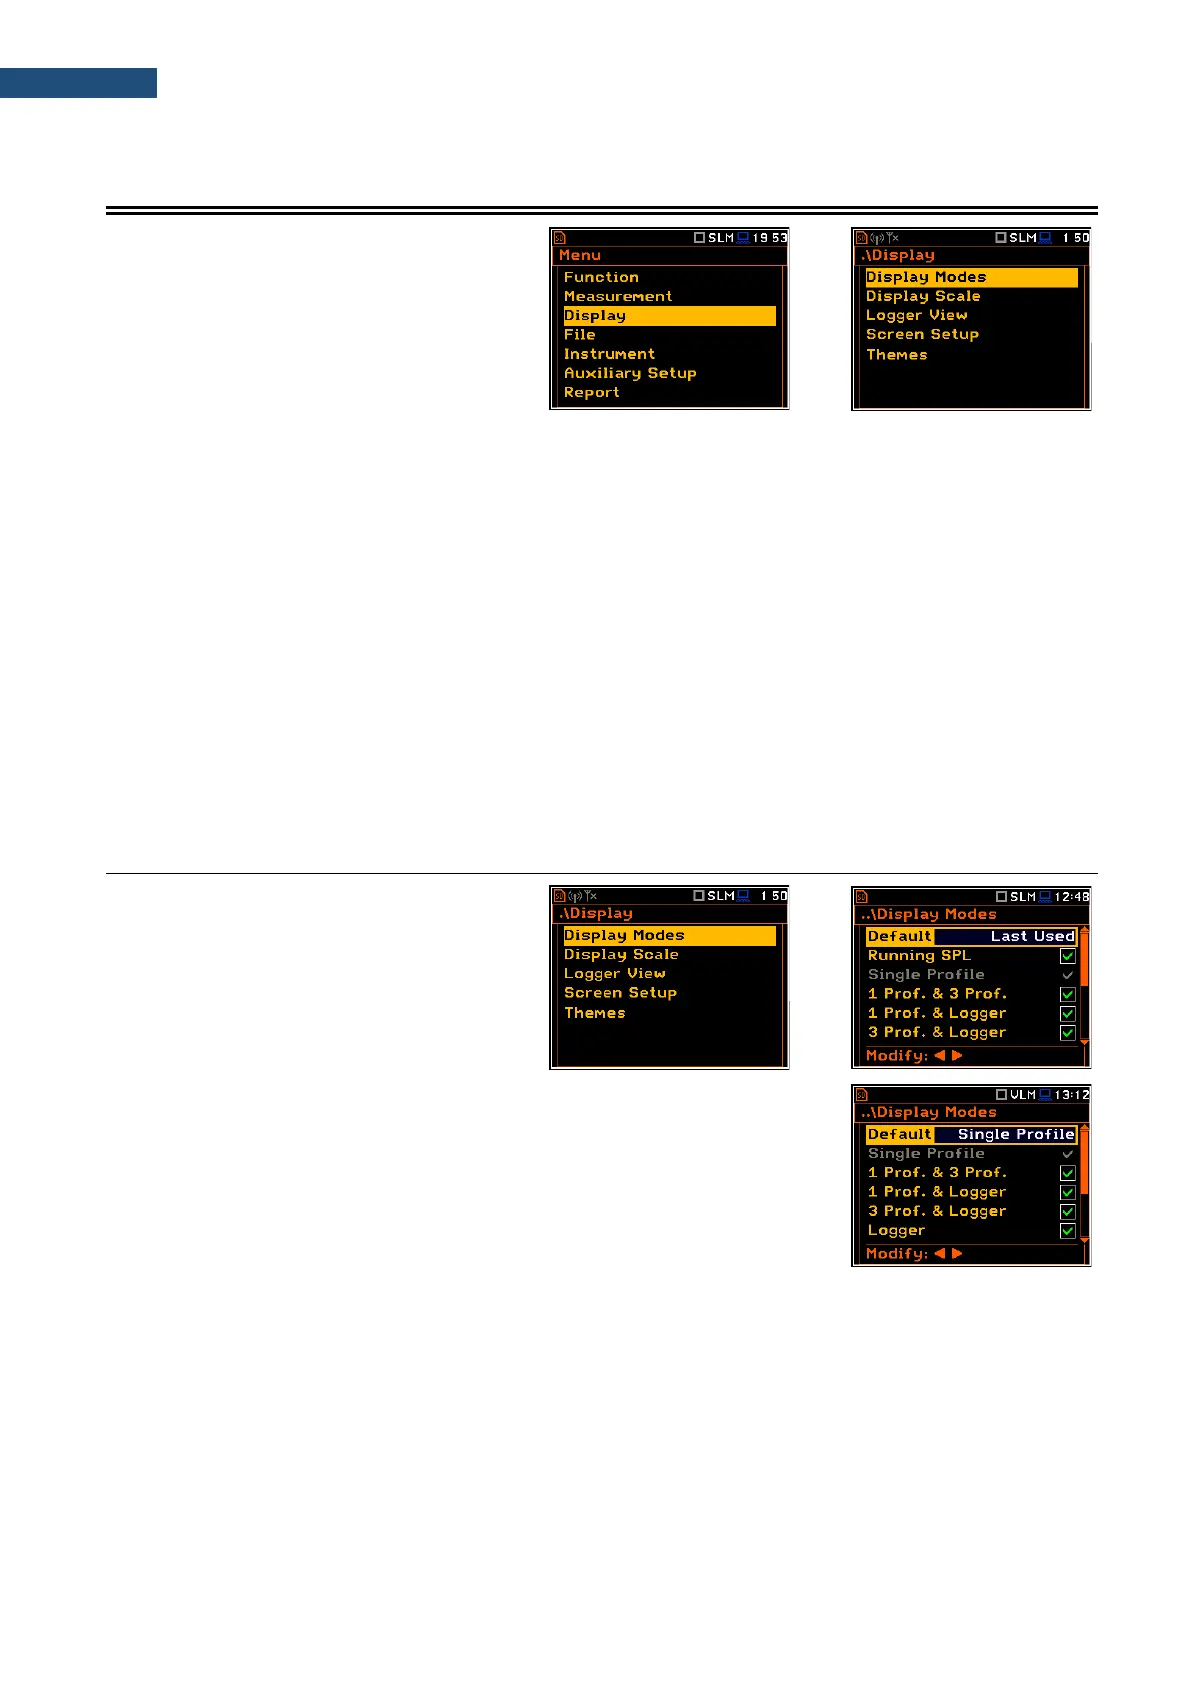
5.1 ENABLING VIEWS – DISPLAY MODES
The Single Profile view is always active and
available. Other views can be enabled or
disabled in the Display Modes screen.
You may change views among those, that
were enabled in the Display Modes screen.
In the Sound Level Meter mode, following views are available: Running SPL,
Single Profile, 1 Prof. & 3 Prof, 1 Prof. & Logger, 3 Prof. & Logger,
Logger, Statistics, Meter Table, GPS, File Info and Meteo.
In the Vibration Level Meter, following views are available: Single Profile,
1 Prof. & 3 Prof., 1 Prof. & Logger, 3 Prof. & Logger, Logger, Meter Table,
GPS, File Info and Meteo.
In the Default position, you can define which view will be presented after instrument’s turn on. If you select
Last Used the instrument will be switched to the view used before the instrument turning off.
Changing views
Being in the measurement mode you can switch between views with the ▲ / ▼ key pressed together with <Alt>.