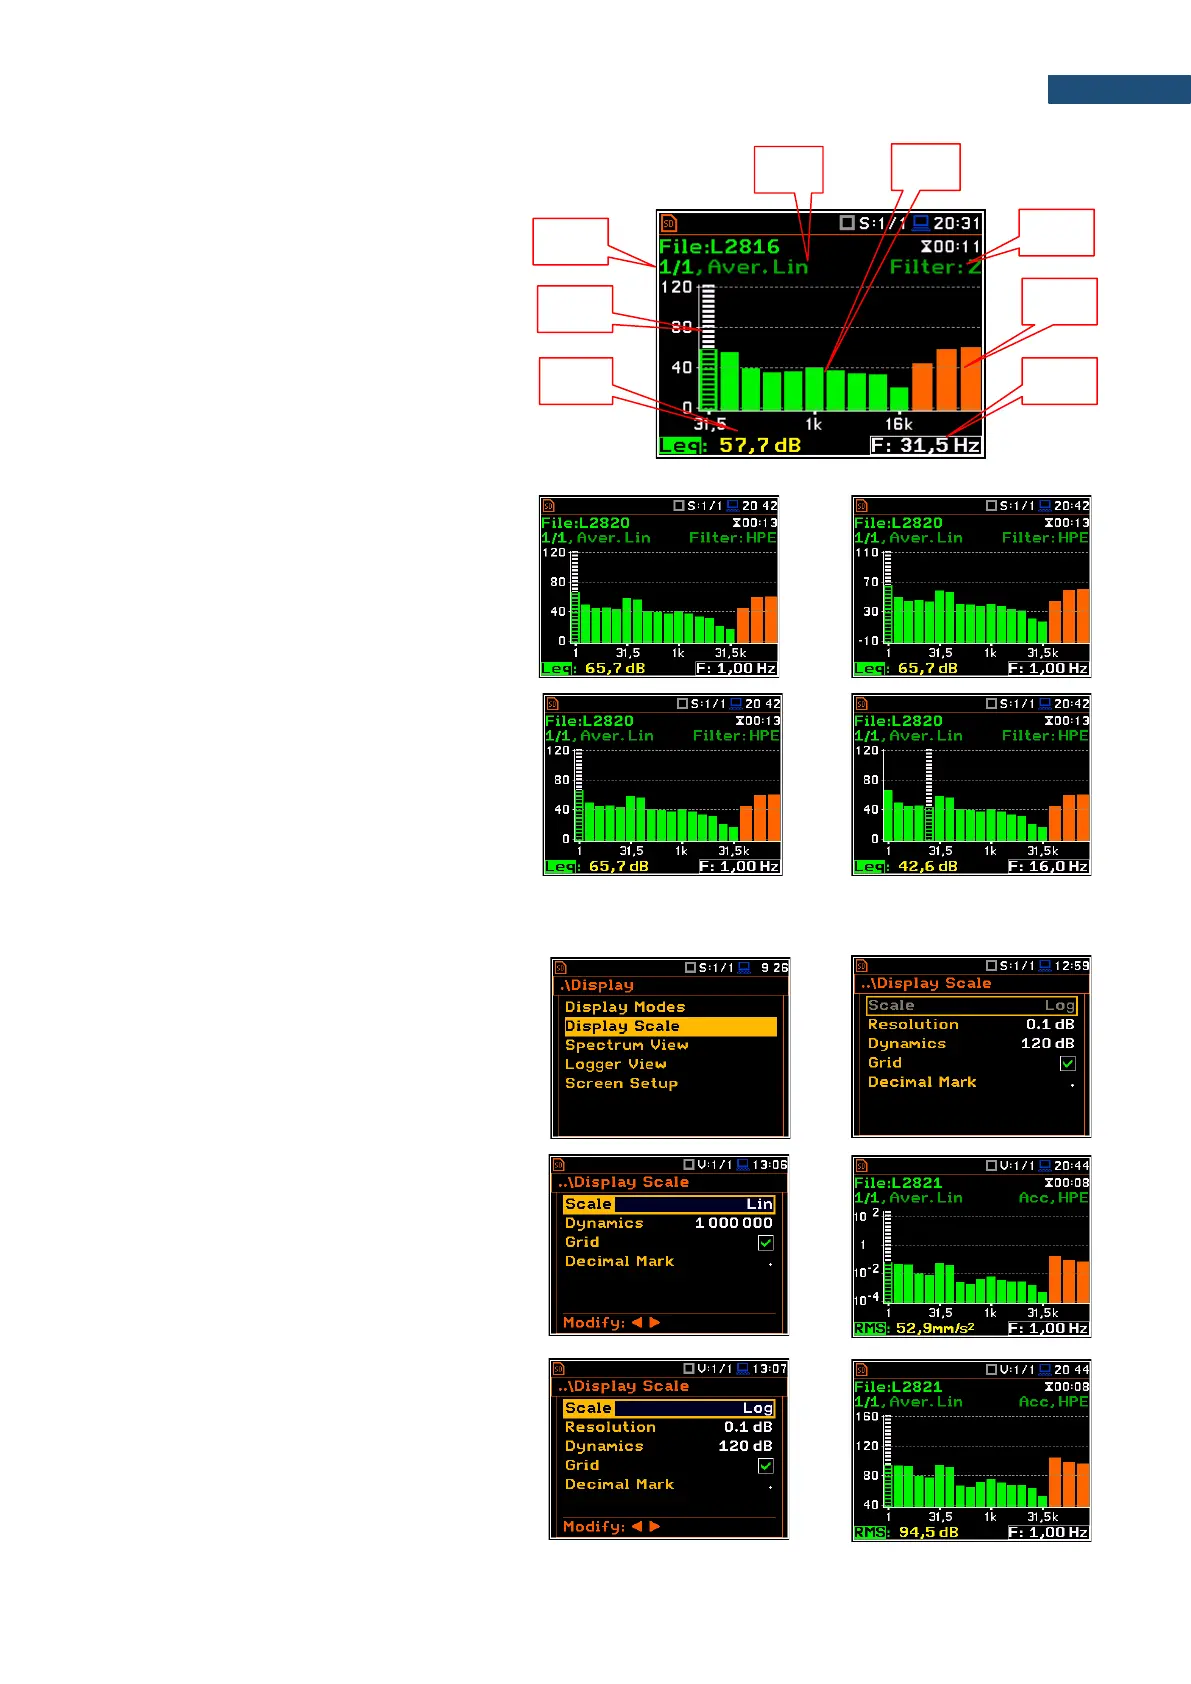
Spectrum view fields
1. Analyser function
2. Cursor position
3. Value of the cursor position
4. Averaging used
5. Spectrum plot
6. Frequency weighting filter
7. Total values
8. Central frequency for the cursor position
You can shift the Y-axis in the spectrum view
with the <Shift> and ▲ / ▼ keys pressed
together.
You can change the cursor position with the
◄ / ► key. You can jump to the first or last
spectrum line with the <Shift> and
◄ / ► keys pressed together.
The band central frequency and the
appropriate value are presented in the line
below the plot.
10.3.2 Customizing the spectrum graph – Display Scale
The Display Scale screen allows you to
define the result units (absolute or
logarithmic), adjust scale of graph and toggle
the grid.
Scale of results presentation
The Scale parameter defines results units:
linear (Lin – m/s
2
, m/s etc.) or logarithmic
(Log - dB).
For sound measurements, the Scale position
is not active. All results are always presented
in dB.
The Log option means that the graphical
presentation is given in the logarithmic scale
and the measurement results are expressed
in decibels (the result is related to the values
set in the Reference Levels screen (path:
<Menu> / Auxiliary Setup /
Reference Levels).