There are three display modes, that combine two views: 1 Prof. & 3 Prof.,
1 Prof. & Logger, 3 Prof. & Logger. These display modes allow you to
compare results for profiles and to follow the history of measured results, saved
in the logger file.
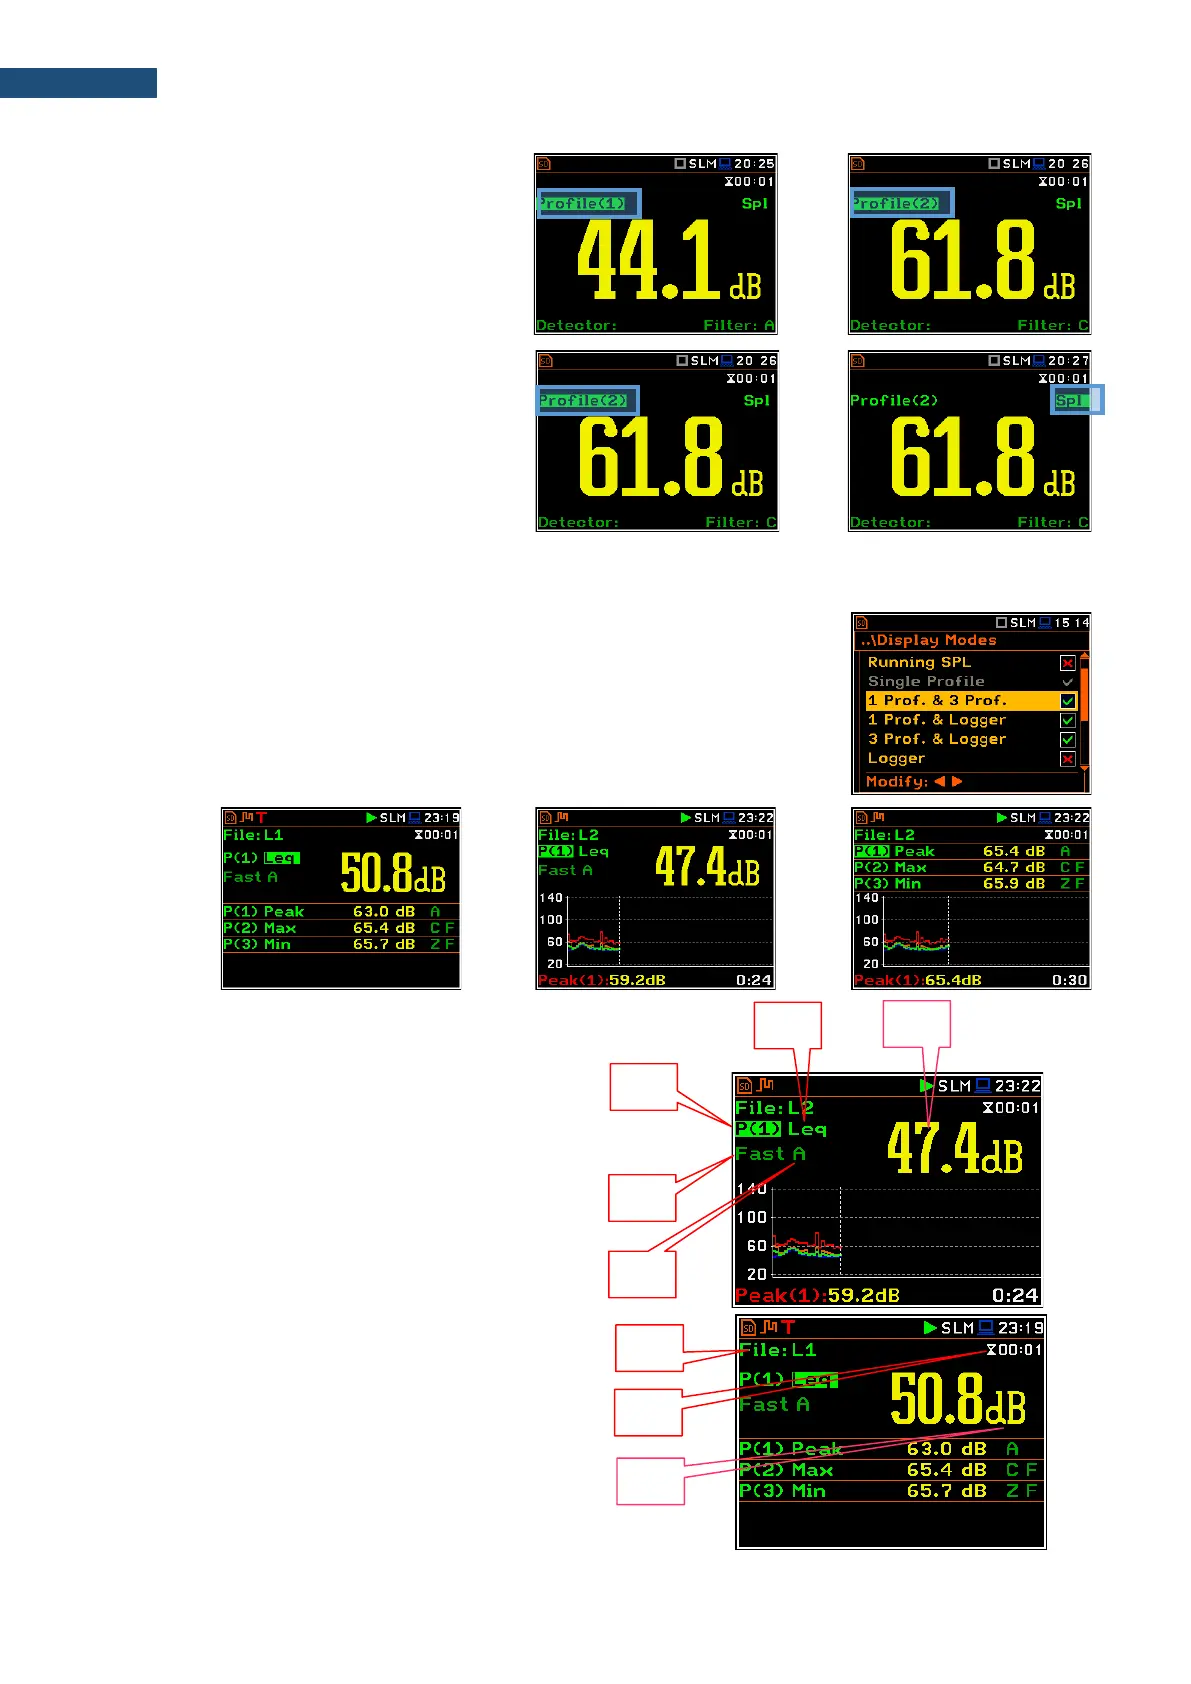
Single Profile view fields
1. Profile number.
2. Result name: Spl, Leq, SEL, Lden, LEPd, Ltm3,
LTeq, Ln, EX, SD, LR1, LR2, Ovl, Peak, Max,
Min for Sound measurements or RMS, Ovl, Peak,
P–P for Vibration measurements.
3. Detector type: Linear or Imp., Fast, Slow for
Sound measurements and Linear or 100 ms,
125 ms, .. 10.0 s for Vibration measurements.
4. Weighting filter: Z, A, C, B, U, UA, D, LF, HP for
Sound measurements or HP, HP1, HP3, HP10,
Vel1, Vel3, Vel10, VelMF, Dil1, Dil3, Dil10, Wh
for Vibration measurements.
5. Value of the measured result.
6. Units of the measured value.
7. Elapsed time, showing the current second of the
measurement. The value presented here belongs
to the range [1, Integration Period].
8. File name when Logger is enabled (path:
<Menu> / Measurement / Logging / Logger
Setup).