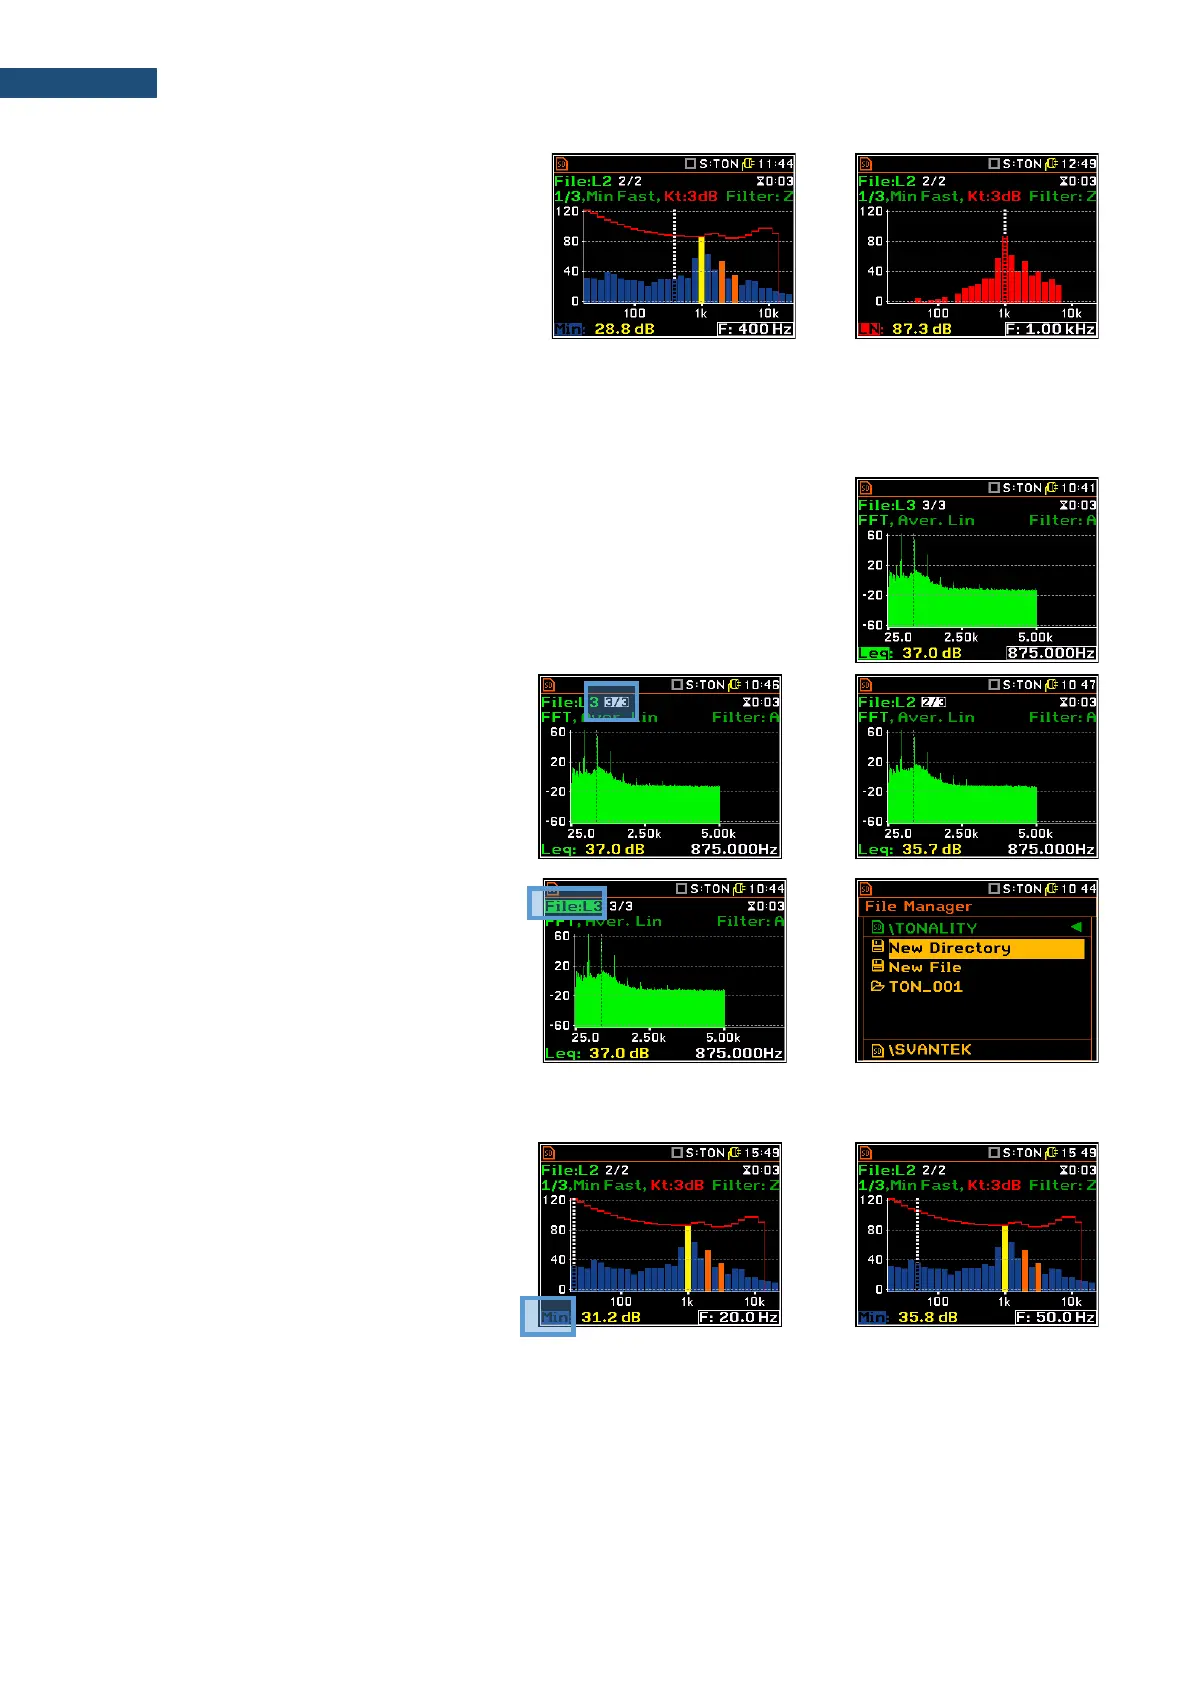
1/3 octave results
In the left example, the most pronounced tone
can be seen (yellow colour) as well as additional
tones (1/3 bandwidths) are marked by orange
colour. The equal-loudness level contour
corresponding to the highest tone in the
spectrum according to ISO 226:1987 or
ISO 226:2003, depending on the Standard
settings, is shown as red line.
In the right example, the corresponding loudness levels (Phon) to each 1/3 band are shown. The absence of the
result in a particular bandwidth indicates that the loudness level doesn’t meet the requirements of the current
standard.
FFT results
The spectrum view shows the FFT spectrum for the selected measurement,
recorded in the file (in the presented example with the name L3).
You can shift manage this view same way as normal FFT spectrum, e.g., shift
cursor position, zoom the spectrum etc.
Changing the measurement file in the
current measurement series
To change the measurement file in the
current measurement series, select the field
with measurements count and press the ◄ /
► key together with <Alt>.
Opening files of a new measurement
series
When the File field is active you may open
files of a new measurement series.
For this, press <ENTER>, and in the
File Manager open the required catalogue
and then select any measurement file and
press <ENTER>.
Changing the cursor position
When the measurement result field is active,
you may change the cursor position with the
◄ / ► key.