SV 977D User Manual - Appendixes
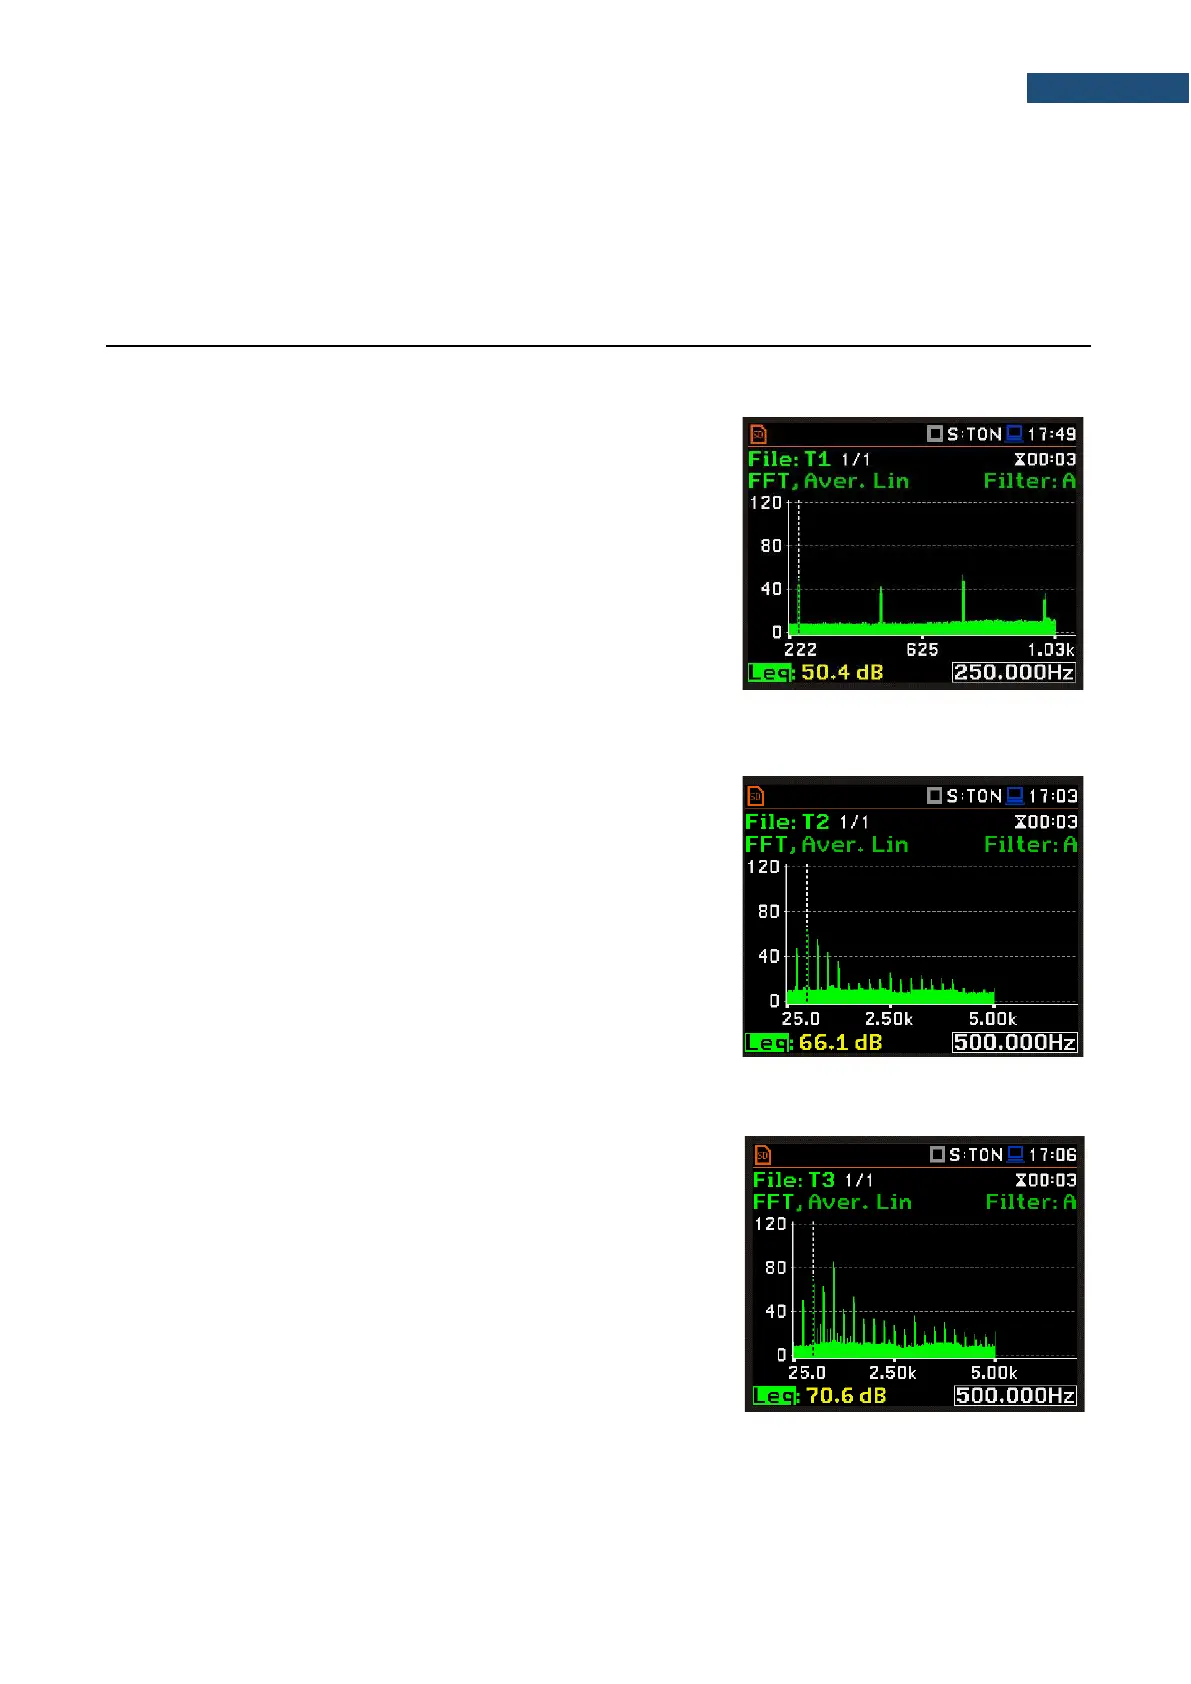
d) A diagrammatic representation of the narrow-band levels across the frequency of the 3-second averaged
spectrum with the greatest ΔL.
e) Tones in other critical bands that may cause an adjustment should be mentioned by their frequencies.
The examples in this subclause have been analysed with an manual procedure based on 5 spectra and a
measurement time of 3 seconds.
EXAMPLE 1:
Tones found: 7.
• Critical band: 203Hz – 306Hz;
• Tone level, L
T
: 50,4 dB;
• Noise level, L
G
: 21.3 dB;
• Audibility, L: 31.2 dB
• Tonal adjustment, Kt: 6.0 dB;
• Mean L: 56.8 dB;
• U90%, extended uncertainty: 2.5dB
EXAMPLE 2:
Tones found: 6.
• Critical band: 443Hz – 559Hz;
• Tone level, L
T
: 66.1 dB;
• Noise level, L
G
: 25.3 dB;
• Audibility, L: 43.1 dB
• Tonal adjustment, Kt: 6.0 dB;
• Mean L: 56.8 dB;
• U90%, extended uncertainty: 2.5dB
EXAMPLE 3:
Tones found: 17.
• Critical band: 921Hz – 1.08kHz;
• Tone level, L
T
: 85.5 dB;
• Noise level, L
G
: 27.8 dB;
• Audibility, L: 60.5 dB
• Tonal adjustment, Kt: 6.0 dB;
• Mean L: 56.8 dB;
U90%, extended uncertainty: 2.5dB
 Loading...


