2-11
ANALYSIS
1 345678
2
1
2
3
4
ANALYSIS
INTRODUCTION
pocH-100
i
Revised February 2011
2.1. ANALYSIS
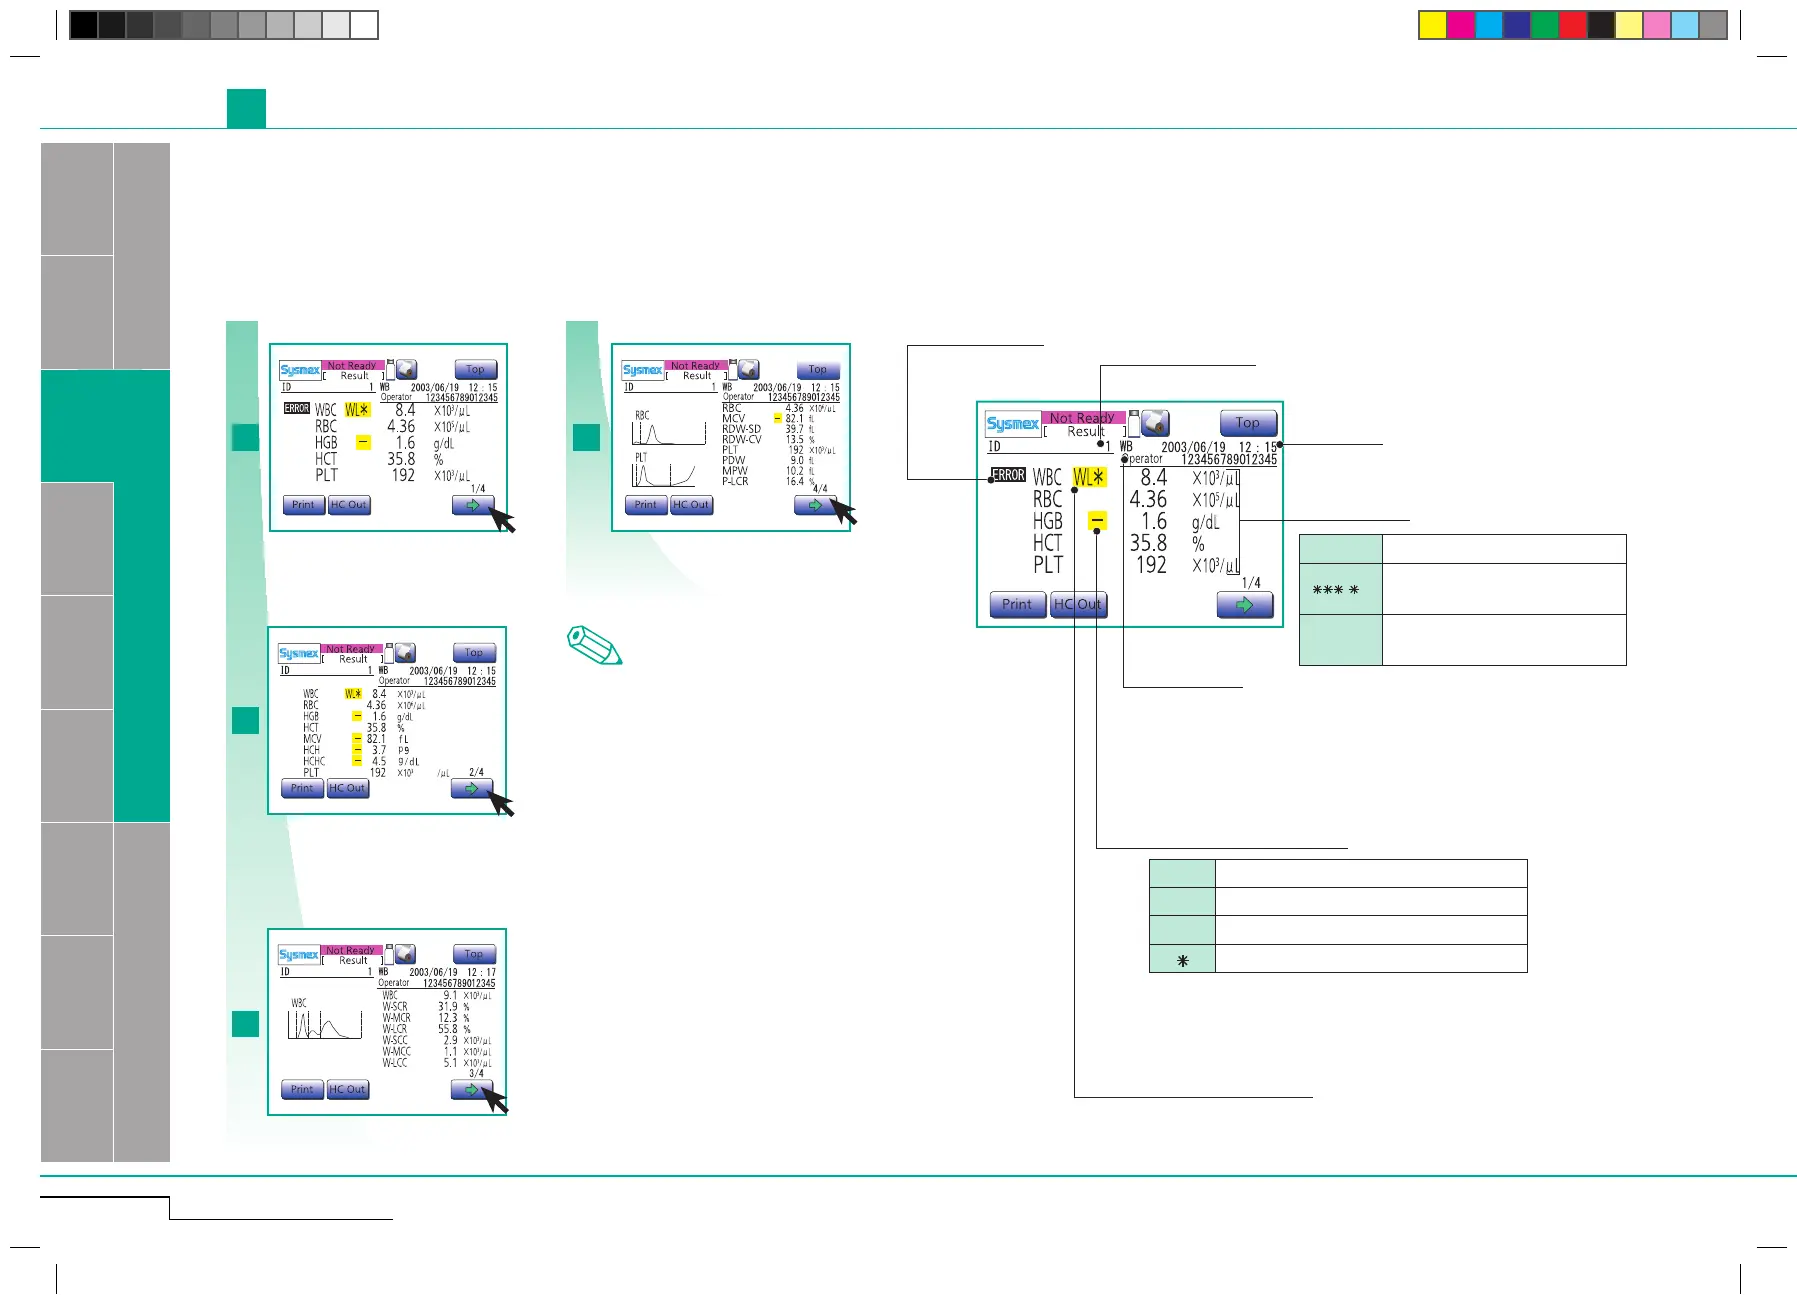
2.1.7. Display analysis results
• After each analysis the results are displayed on the LCD screen.
• This instrument can store analysis results and histograms for up to 100 samples.
• Values outside the specied upper and lower limits are marked, for further analysis and checking.
The analysis result screen is composed of 4 LCD screen pages.
Press arrow to switch to second screen.
Press arrow to switch to third screen.
Press arrow to switch to fourth screen.
Press arrow to switch to first screen again.
Note
First screen
Displays analysis results of WBC, RBC,
HGB, HCT, and PLT parameters.
Second screen
Displays analysis results of WBC, RBC,
HGB, HCT, MCV, MCH, MCHC and PLT
parameters.
Third screen
Displays analysis results of WBC,
LYM% ,
MXD%, NEUT%, LYM#, MXD# and
NEUT# parameters, or alternatively
WBC, W-SCR, W-MCR, W-LCR, W-SCC,
W-MCC and W -LCC parameters.
Fourth screen
Displays analysis results of RBC, MCV,
RDW-SD, RDW-CV, PLT, PDW, MPV, and
P-LCR parameters.
Analysis data
+++.+ Value exceeds display range.
.
Value could not be calculated
be-
cause of analysis error.
---
.
-
Value could not be calculated due
to data error.
Numeric value abnormal flag
! Value is out of the linearity limit.
+ Result exceeds the upper patient limit.
-
Result exceeds the lower patient limit.
Result is unreliable.
Analysis mode
Date/time
Analysis error flag
Volume distribution flag
see "Histogram flags" page 2-12
The first screen
The second screen
The third screen
The fourth screen
Sample ID