286
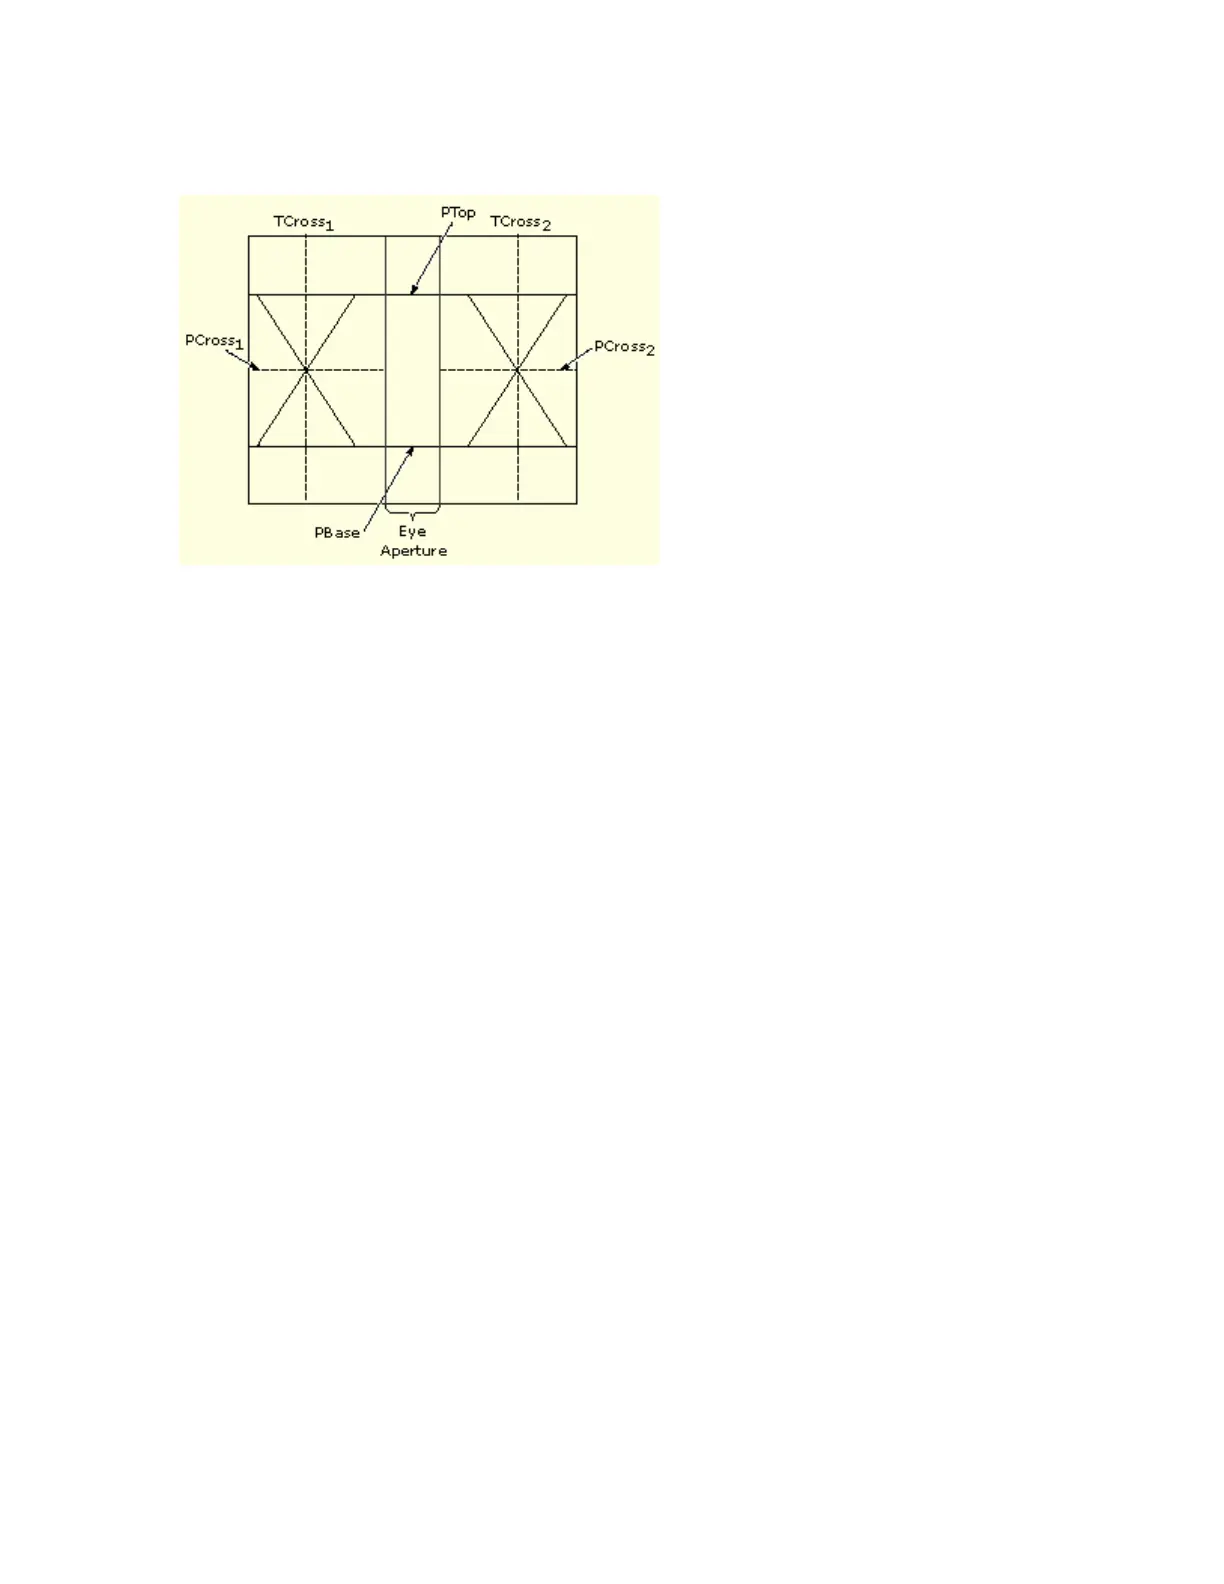
The figure below shows an eye-diagram and the areas from which values are taken that are used to
calculate measurements.
P Values
The P values include the mean and standard deviation of the vertical location of PTop and PBase.
These areas are used with a specified sample size to statistically measure the following values:
PTopmean, the mean value of PTop
PTopsigma, the standard deviation of PTop
PBasemean, the mean value of PBase within the Eye Aperture
*
PBasesigma, the standard deviation of PBase within the Eye Aperture
*
*
The Eye Aperture defaults to the center 20 % of the interval from TCross1 to TCross2.
T1 Values
The T1 values are vertical and horizontal values associated with the leftmost crossing point. These
areas are used to establish the following values:
TCross1mean, the horizontal mean of the left crossing point at TCross1
TCross1sigma, the horizontal standard deviation of the left crossing point at TCross1
TCross1pk-pk, the horizontal peak-to-peak deviation of the left crossing point at TCross1
PCross1mean, the vertical mean of the left crossing point at PCross1
T2 Values
The T2 values are vertical and horizontal values associated with the rightmost crossing point.
These areas are used to establish the following directions:
TCross2mean, the horizontal mean of the right crossing point at TCross2
TCross2sigma, the horizontal standard deviation of the right crossing point at TCross2
TCross2pk-pk, the horizontal peak-to-peak deviation of the right crossing point at TCross2
DCD Values
The duty cycle distortion (DCD) values are horizontal values associated with the rightmost
crossing point at 50% of the eye height. These areas are used to establish the DCDpk-pk, the
horizontal peak-to-peak deviation of the left crossing point at half the height of the eye.
 Loading...