Chapter 9
NOTE: You may find it helpful to place a piece of paper or a ruler under the row (or to the
right of the column) in which the data appear to help avoid entering an incorrect value.
You can reuse the input data from Ex.
1 of Section 9.3 and enter
the output
in L2.
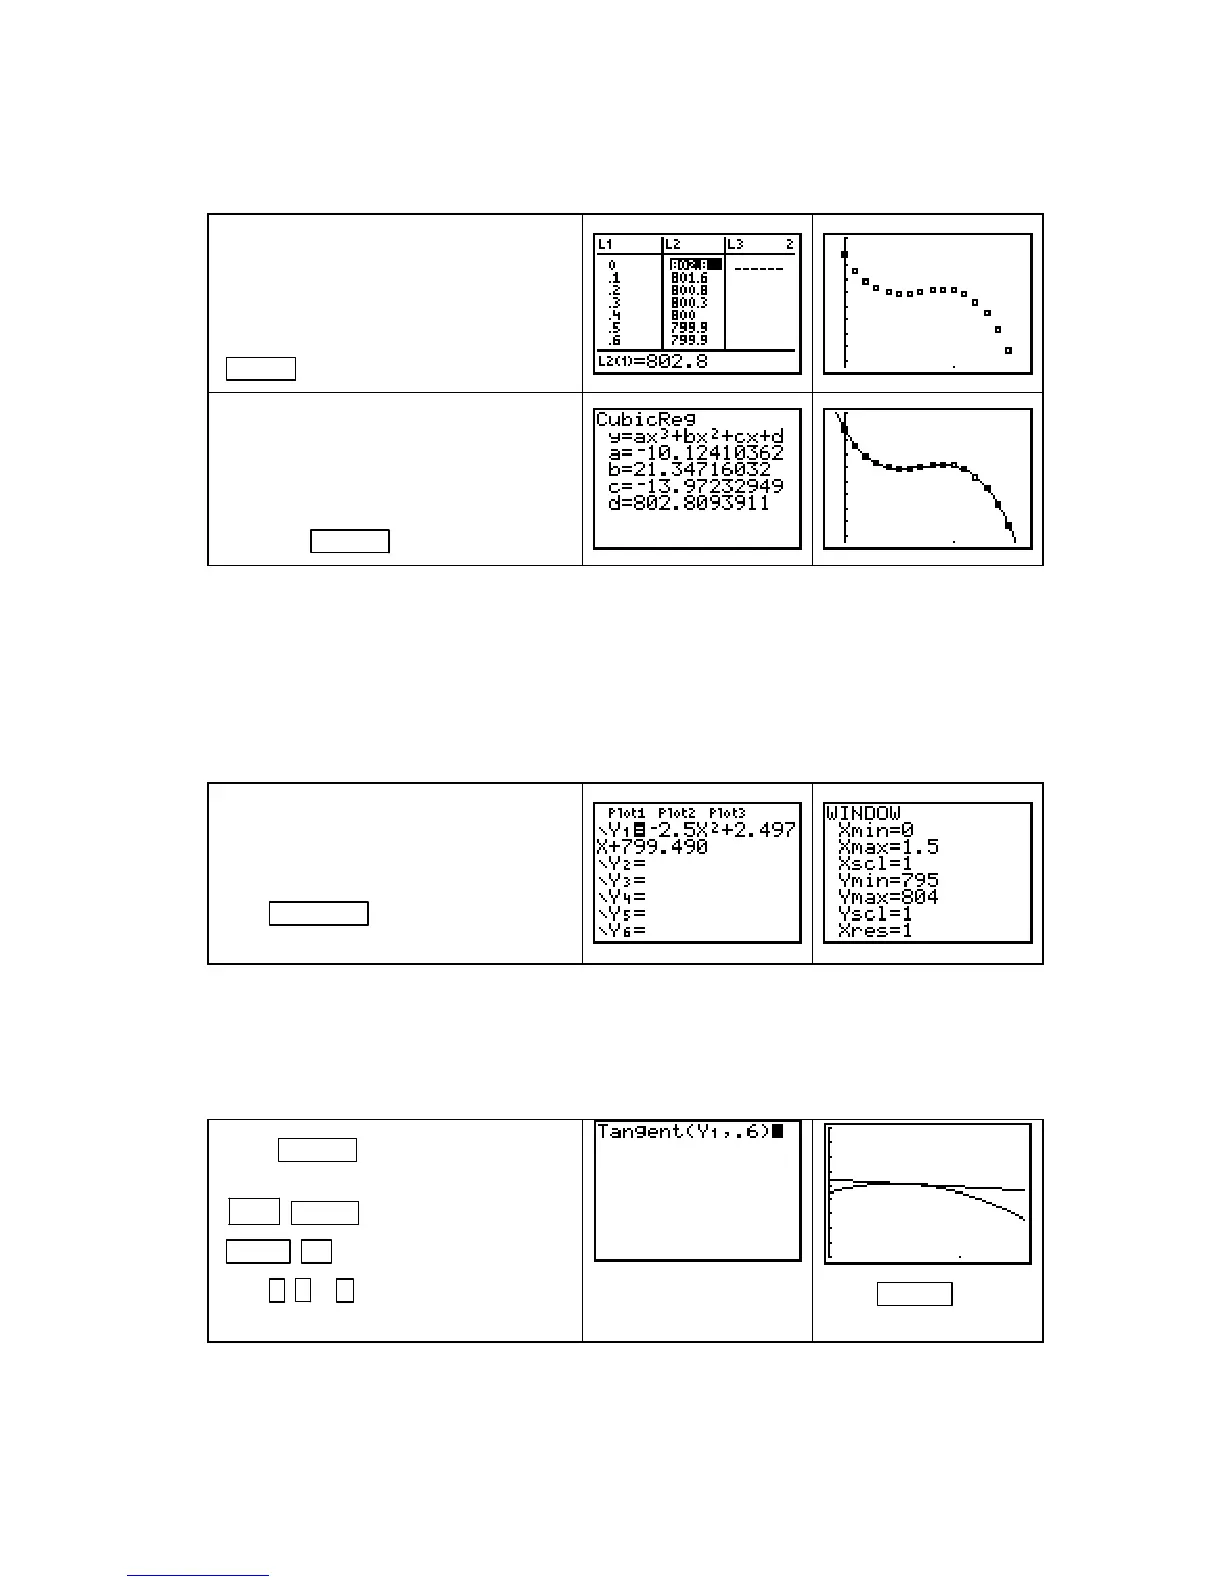
, Next, clear any functions
from the
Y= list, and turn on Plot1.
Draw a scatter plot of the data with
ZOOM 9 [ZoomStat].
There is an inflection point and no
evidence of limiting values, so the
data appear to be cubic. Fit a cubic
function and copy it to the
Y= list.
Draw the cubic function on the scatter
plot with
GRAPH .
VISUALIZING AND ESTIMATING RATES OF CHANGE OF CROSS SECTIONS
The rate of change of a multivariable function (when evaluated at a specific point) is the slope
of the line tangent to the graph of a cross-sectional function at that point. We illustrate this
concept in this section and the next using the Missouri farmland cross-section equations for
elevation:
E(0.8, n) and E(e, 0.6). It would be best to use the unrounded functions that were
found in the previous example of this
Guide. However, to illustrate the rate-of-change
techniques, we use the rounded functions rather than re-enter all the data.
Enter
−
2.5n
2
+ 2.497n + 799.490 =
E(0.8, n) in Y1. Because we are going
to graph this function, use
X, not n, as
the input variable.
Press
WINDOW and set values such
as those shown to the right.
The window settings used above can be obtained by drawing a scatter plot of the data used to
find
E(0.8, n) or by looking at the e = 0.8 column in Table 9.3 in Calculus Concepts. The line
tangent to the graph at
n = X = 0.6 can be drawn from either the home screen or the graphics
screen. (See p. 46 of this
Guide for an explanation of both methods.) We use the home screen
method in this section and the graphics screen method in the next.
Press GRAPH to draw the graph of
Y1. Return to the home screen. Press
2ND PRGM (DRAW) 5 [Tangent(]
VARS
► [Y−VARS] 1 [Function] 1
[Y1] , . 6 ) .
This command draws the
line tangent to E(0.8, n) =
Y1 at n = 0.6.
Press ENTER to see
the tangent line.
Copyright © Houghton Mifflin Company. All rights reserved.
100

 Loading...


