TI-83, TI-83 Plus, TI-84 Plus Guide
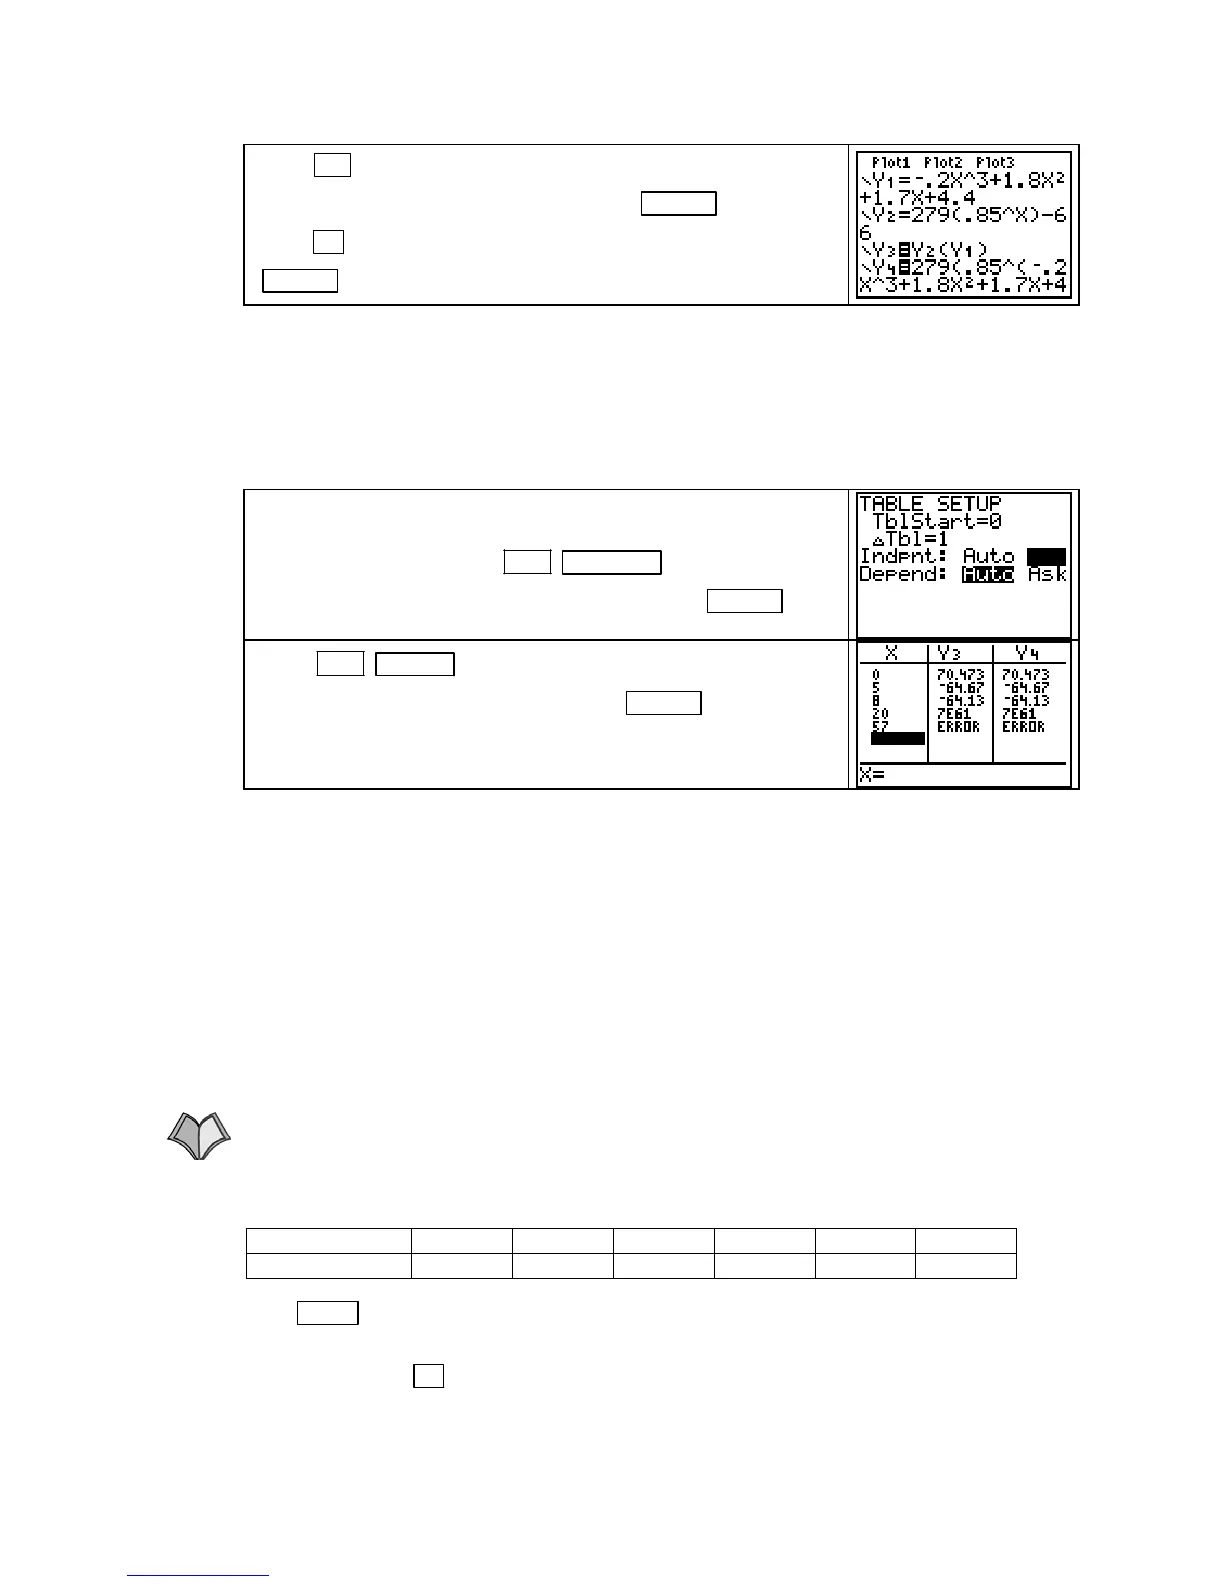
Press
Y= and, using one of the arrow keys, move the cursor
until it covers the darkened = in
Y1. Press ENTER . Then,
press
▼ until the cursor covers the darkened = in Y2. Press
ENTER . Y1 and Y2 are now turned off.
A function is turned off when the equals sign in its location in the graphing list is not dark. To
turn a function back on, simply reverse the above process to make the equal sign for the func-
tion dark. When you draw a graph, the TI-83 graphs of all functions that are turned on. You
may at times wish to keep certain functions entered in the graphing list but not have them graph
and not have their values shown in the table. Such is the case in this illustration.
We now return to checking to see that
Y3 and Y4 represent the same function.
Choose the ASK setting in the table setup so that you can check
several different values for both
Y3 and Y4. Recall that you
access the table setup with
2ND WINDOW (TBLSET). Move
the cursor to
ASK in the Indpnt: location and press ENTER .
Press 2ND GRAPH (TABLE), type in the x-value(s) at which
the function is to be evaluated, and press
ENTER after each one.
We see that because all these outputs are the same for each
function, you can be fairly sure that your answer is correct.
Why does ERROR appear in the table when x = 57? Look at the value when x = 20; it is very
large! The computational limits of the calculator have been exceeded when x = 57. This is an
OVERFLOW ERROR.
.
1.2 Linear Functions and Models
This portion of the Guide gives instructions for entering real-world data into the calculator and
finding familiar function curves to fit that data. You will use the beginning material in this
section throughout all the chapters in Calculus Concepts.
CAUTION: Be very careful when you enter data in your calculator because your model and
all of your results depend on the values that you enter! Double check your entries.
1.2.1 ENTERING DATA We illustrate data entry using the values in Table 1.11 in Section 1.2 of
Calculus Concepts:
Year 1999 2000 2001 2002 2003 2004
Tax (dollars) 2532 3073 3614 4155 4696 5237
Press STAT 1 [EDIT] to access the 6 lists that hold data. You see only the first 3 lists, (L1, L2,
and
L3) but you can access the other 3 lists (L4, L5, and L6) by having the cursor on the list
name and pressing
► several times. If you do not see these list names, return to the statistical
setup instructions on page A-1 of this Guide.
Copyright © Houghton Mifflin Company. All rights reserved.
17

 Loading...


