TI-83, TI-83 Plus, TI-84 Plus Guide
VISUALIZING THE LIMITING PROCESS This section of the Guide is optional, but it
might help you understand what it means for the tangent line to be the limiting position of
secant lines. Program SECTAN is used to view secant lines between a point (a, f(a)) and close
points on a curve y = f(x). The program also draws the tangent line at the point (a, f(a)). We
illustrate with the graph of the function T that was used in the previous two sections, but you
can use this program with any graph. (Program
SECTAN is Program Appendix of this Guide.)
Caution: Before using program
SECTAN, a function (using x as the input variable) must be
entered in the
Y1 location of the Y= list. In order to properly view the secant lines and the
tangent line, you must first draw a graph clearly showing the function, the point of tangency
(which should be near the center of the graph), and a large enough window so that the close
points on either side of the point of tangency can be viewed.
Have T(x) =
−
0.804x
2
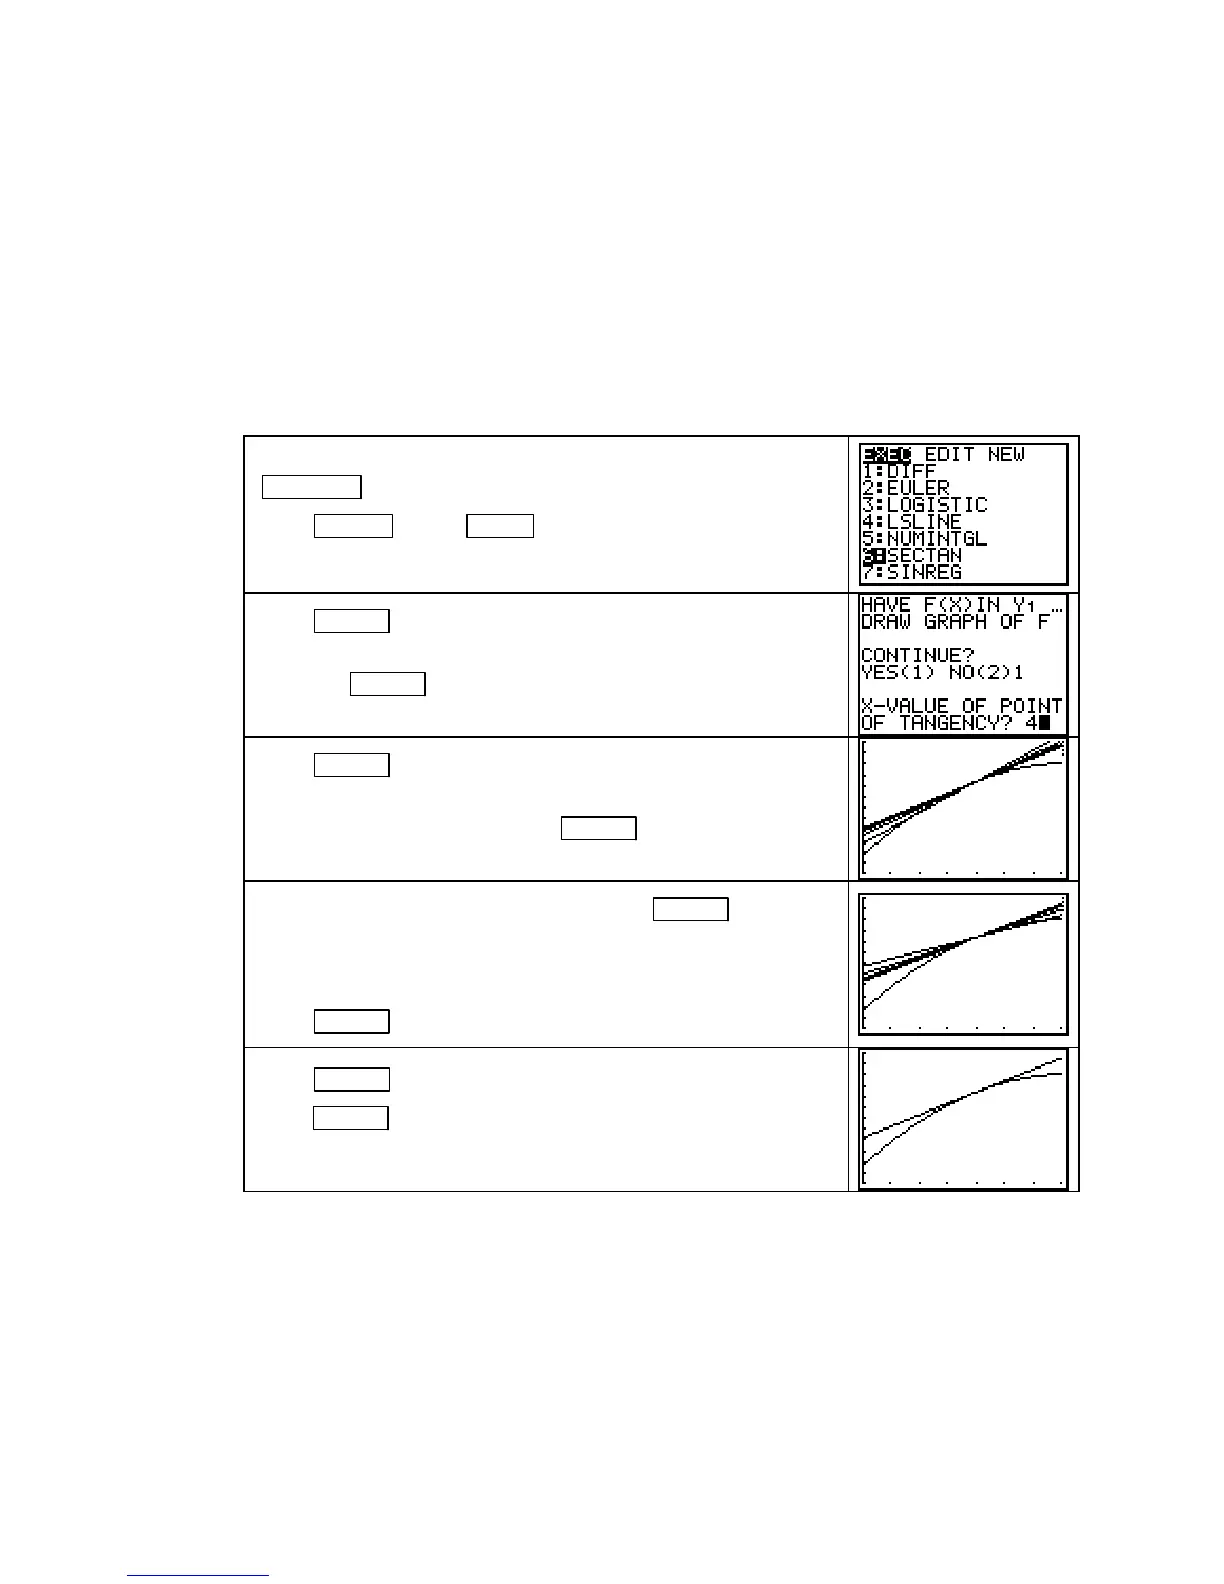
+ 11.644x + 38.114 in Y1. Next, press
WINDOW and set Xmin = 0, Xmax = 7, Ymin = 30, Ymax = 90.
Press GRAPH . Press PRGM and the number or letter next to
the location of program
SECTAN. (Your program list may not
look like the one shown on the right.)
Press ENTER to start the program. If you forgot to enter the
function in
Y1 or to draw its graph, enter 2. Otherwise, type 1
and press
ENTER . At the next prompt, type the input value at
the point of tangency. (For this illustration, choose x = 4.)
Press ENTER . The next message that appears tells you to press
enter to see secant lines drawn between the point of tangency
and close points to the left. Press
ENTER . (Five secant lines
will draw.)
When you finish looking at the graph, press ENTER to
continue. The next message that appears tells you to press enter
to see secant lines drawn between the point of tangency and
close points to the right. (Again, five secant lines will draw.)
Press
ENTER .
Press ENTER to continue the program. You are next told to
press
ENTER to see a graph of the line that is tangent to the
curve at x = 4.
As you watch the graphs, you should notice that the secant lines are becoming closer and
closer to the tangent line as the close point moves closer and closer to the point of tangency.
TANGENT LINES AND INSTANTANEOUS RATES OF CHANGE Sometimes the
calculator gives results that are not the same as the mathematical results you expect. This does
not mean that the calculator is incorrect – it does, however, mean that the calculator
programming is using a different formula or definition than the one that you are using. You
need to know when the calculator produces a different result from what you expect from our
formulas.
Copyright © Houghton Mifflin Company. All rights reserved.
47

 Loading...


