Chapter 1
Press
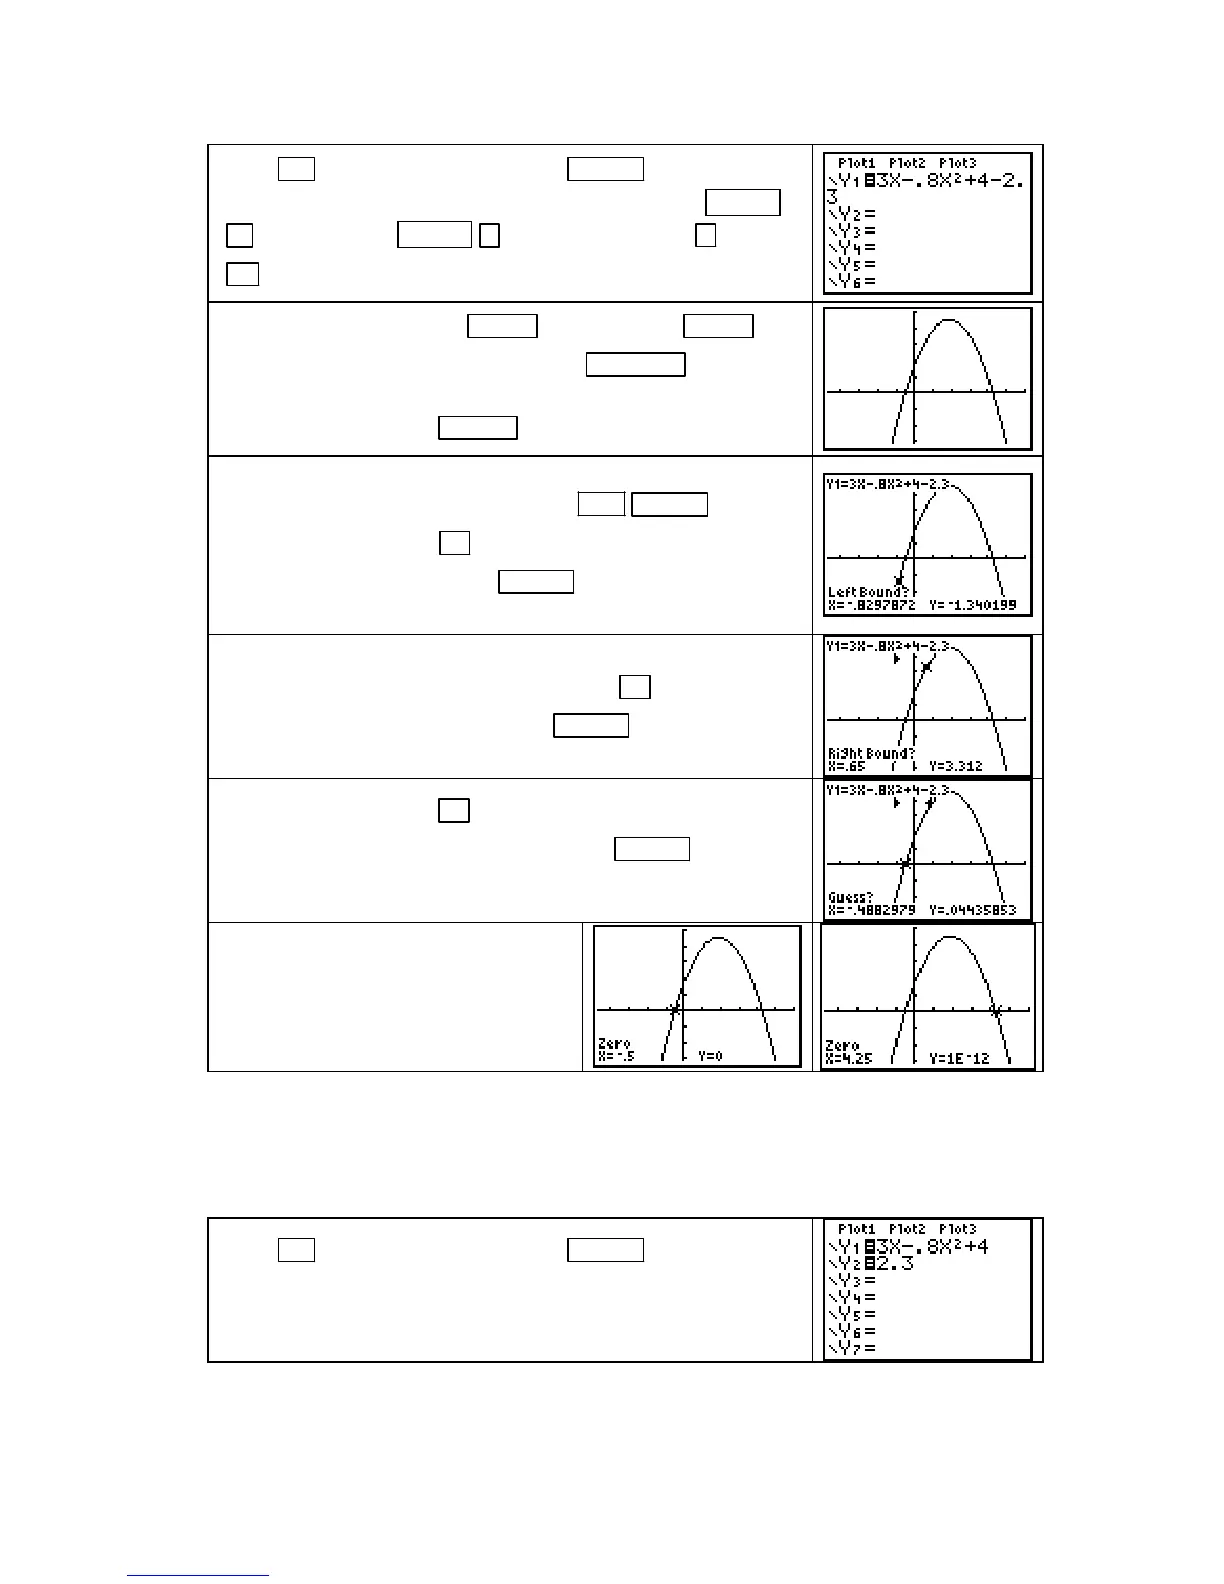
Y= and clear all locations with CLEAR . Enter the func-
tion 3x – 0.8x
2
+ 4 – 2.3 in
Y1. You can enter x
2
with X,T,θ,n
x
2
or enter it with X,T,θ,n ^ 2. Remember to use − , not
(−) , for the subtraction signs.
Draw the graph of Y1 with ZOOM 4 [Zdecimal] or ZOOM 6
[ZStandard].
If you use the former, press WINDOW and reset
Xmax
to 6 and Ymax to 5 to get a better view the graph. (If you
reset the window, press
GRAPH to draw the graph.)
To graphically find an x-intercept, i.e., a value of x at which the
graph crosses the horizontal axis, press
2ND TRACE (CALC)
2 [zero].
Press and hold ◄ until you are near, but to the left of,
the leftmost x-intercept. Press
ENTER to mark the location of
the left bound for the x-intercept.
Notice the small arrowhead (`) that appears above the location
to mark the left bound. Now press and hold
► until you are
to the right of this x-intercept. Press
ENTER to mark the
location of the right bound for the x-intercept.
For your “guess”, press ◄ to move the cursor near to where
the graph crosses the horizontal axis. Press
ENTER .
The value of the leftmost x-intercept
has the x-coordinate
X =
−
0.5.
Repeat the above procedure to find the
rightmost x-intercept. Confirm that it
occurs where
X = 4.25.
NOTE: If this process does not return the correct value for the intercept that you are trying to
find, you have probably not included the place where the graph crosses the axis between the
two bounds (i.e., between the
` and _ marks on the graph.)
INTERSECTION METHOD for solving the equation f(x) = c:
Press
Y= and clear all locations with CLEAR . Enter one side
of the equation, 3x – 0.8x
2
+ 4 in
Y1 and the other side of the
equation, 2.3, in
Y2.
Copyright © Houghton Mifflin Company. All rights reserved.
12

 Loading...


