Chapter 1
• Lists can be named and stored in the calculator’s memory for later recall and use. Refer to
p.23 of this Guide for instructions on storing data lists and later recalling them for use.
CAUTION:
Any time that you enter the name of a numbered list (for instance: L1, L2, and
so forth), you should use the calculator symbol for the name,
not a name that you type with
the alphabetic and numeric keys. For example, to enter the list name
L1 on the calculator,
press
2ND 1 (L1). If you instead entered L1 with the keystrokes ALPHA ) (L) 1, you
would create a new list called L1 that the calculator would not recognize as the list containing
data that you entered while in the
STAT [EDIT] mode.
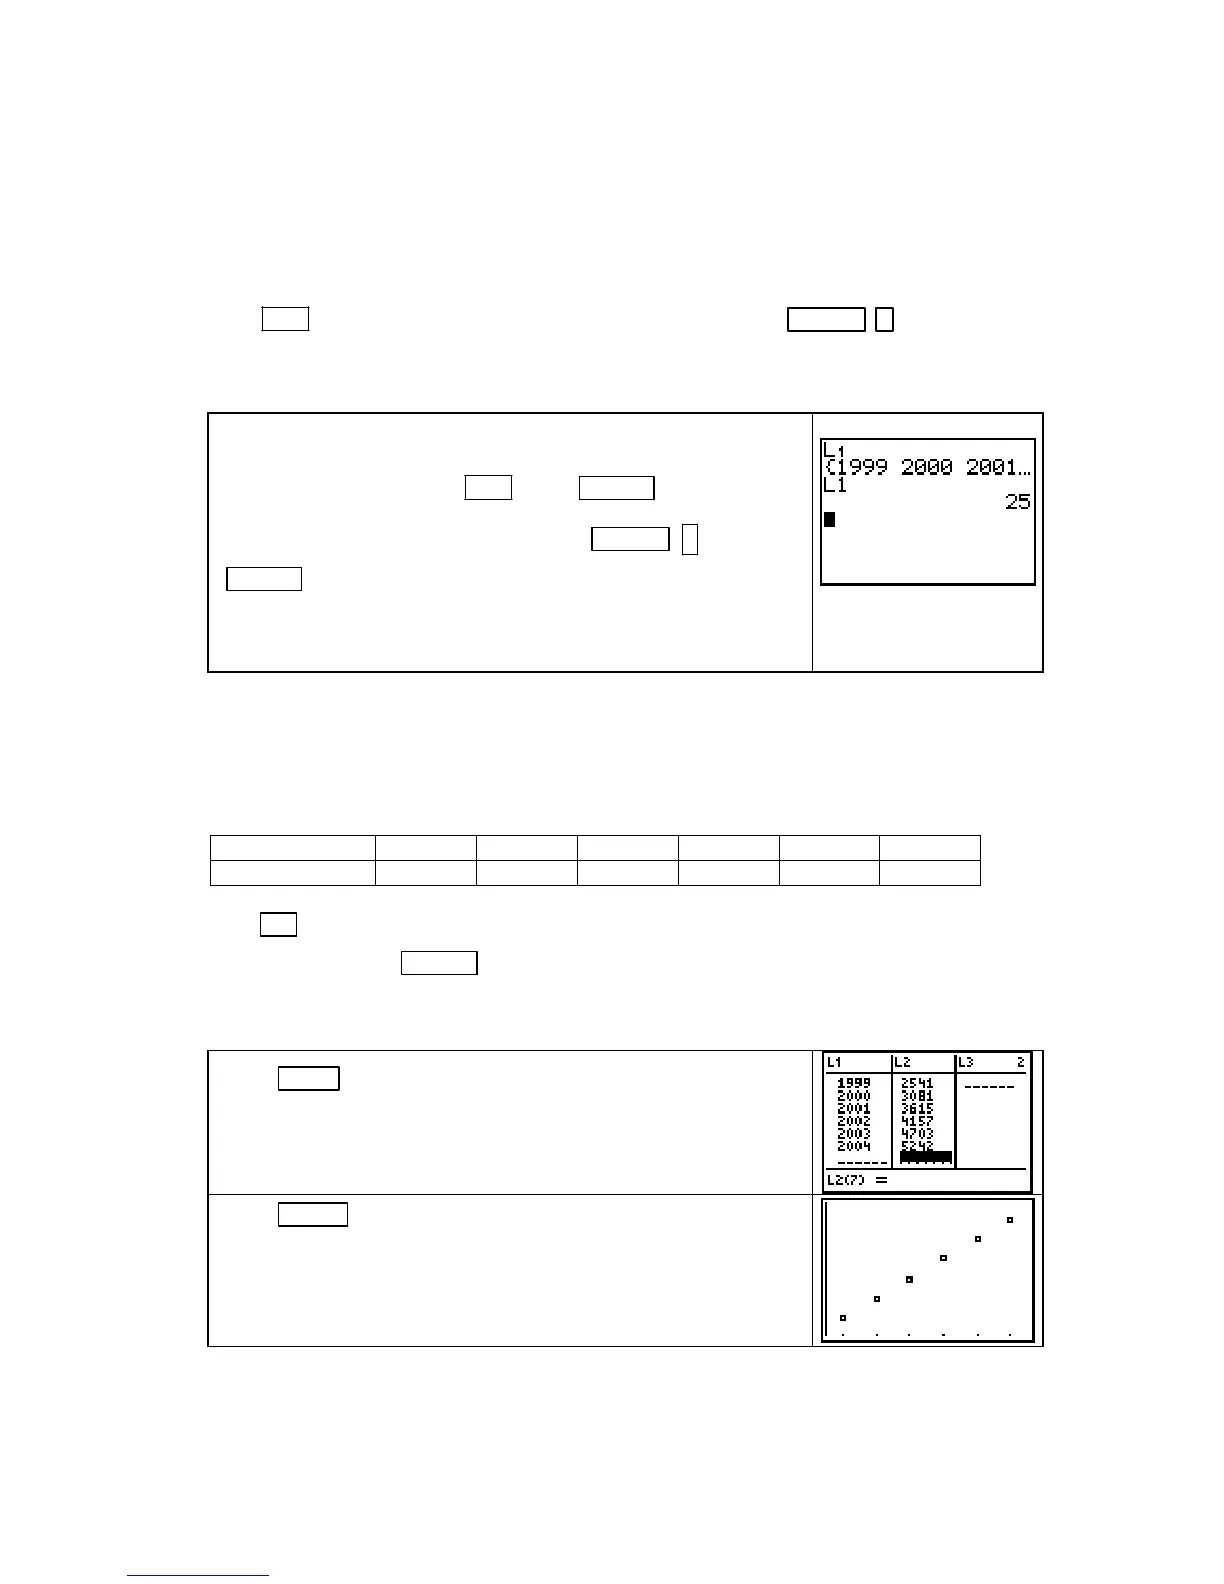
The screen to the right contains three entries marked L1. The
first is the statistical list
L1 that contains input data. See what is
in your
L1 list by pressing 2ND 1 (L1) ENTER .
The second entry is obtained by pressing
ALPHA ) (L) 1
ENTER
. Whatever constant is stored in memory location L
multiplied by 1 is what you see printed on the screen.
Your list L1 may not
contain the same values as
the one shown above.
DRAWING A SCATTER PLOT OF DATA Any functions that are turned on in the Y= list
will graph when you plot data. Therefore, you should clear or turn them off before you draw a
scatter plot. We illustrate how to graph data using the modified tax data that follows Example
2 in Section 1.2 of Calculus Concepts.
Year 1999 2000 2001 2002 2003 2004
Tax (in dollars) 2541 3081 3615 4157 4703 5242
Press Y= . If any entered function is no longer needed, clear it by moving the cursor to its
location and pressing
CLEAR . If you want the function(s) to remain but not graph when you
draw the scatter plot, refer to page 16 of this Guide for instructions on how to turn function(s)
off. Also be sure that
Plot 1 on the top left of the Y= screen is darkened.
Press STAT 1 [EDIT]. Using the table given above, enter the
year data in
L1 and the modified tax data in L2.
(You can either leave values in the other lists or clear them.)
Press ZOOM 9 [ZoomStat] to have the calculator set an auto-
scaled view of the data and draw the scatter plot.
Note that
ZoomStat does not reset the x- and y-axis tick marks.
You should do this manually with the
WINDOW settings if you
want different spacing between the tick marks.)
Recall that if the data are perfectly linear (that is, every data point falls on the graph of a line),
the first differences in the output values are constant. The first differences for the original tax
Copyright © Houghton Mifflin Company. All rights reserved.
20
 Loading...


